$SPONGE (SPONGE/USD): Consolidation at $0.0001 – Potential Buying Opportunity
Estimated Reading Time: 2 minutes
Don’t invest unless you’re prepared to lose all the money you invest. This is a high-risk investment and you are unlikely to be protected if something goes wrong. Take 2 minutes to learn more

SPONGE/USD is currently consolidating around the $0.0001 price level. This prolonged period of stability at this support suggests potential bullish momentum. The market’s inability to break below this level indicates a strong support zone, potentially attracting buyers looking for a dip. The next target for a bullish move is likely $0.000108.
Key Levels to Monitor
- Resistance: $0.000110, $0.00012, $0.00013
- Support: $0.000090, $0.0000850, $0.00008
SPONGE/USD Market Analysis: Technical Viewpoint
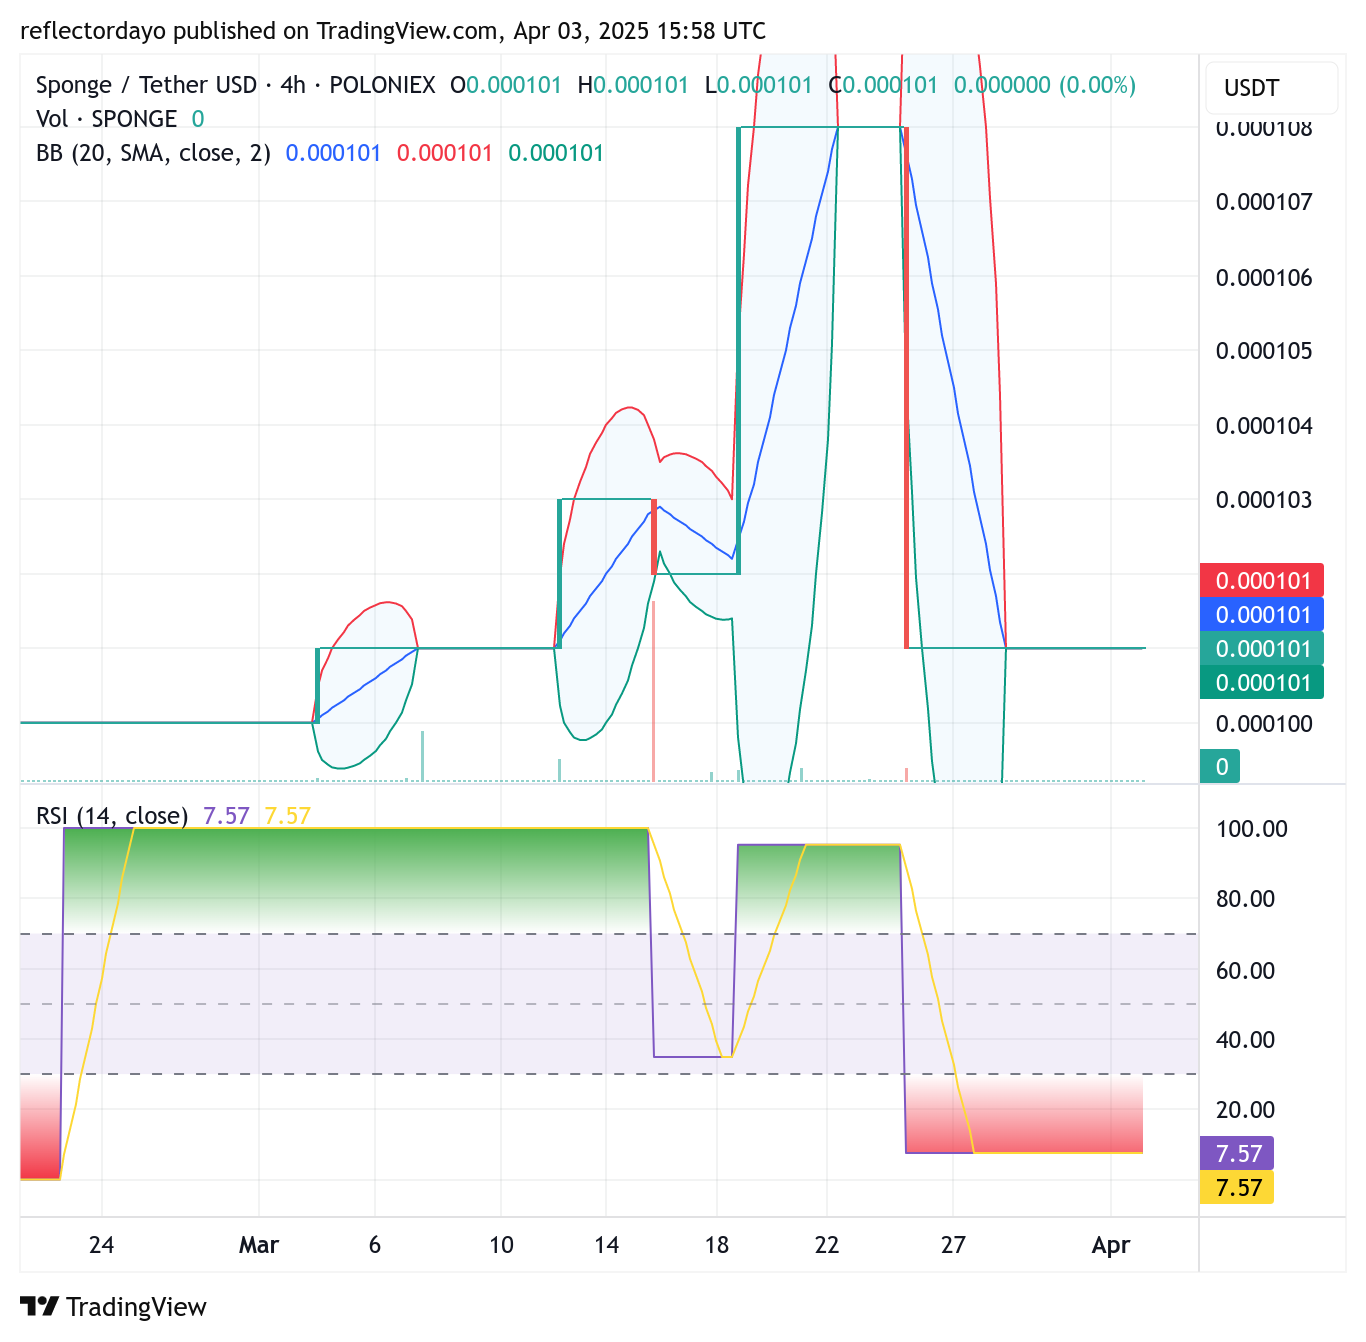
The consolidation around $0.0001 indicates potential accumulation in the SPONGE/USD market. Traders may be positioning for a bounce. The current price action suggests a weakening of bearish momentum, potentially allowing for a bullish breakout. The narrowing Bollinger Bands indicate low volatility, which often precedes significant price movements. The alignment of the support level with a potential bullish zone strengthens the possibility of an upward breakout.

SPONGE/USD 1-Hour Chart: Breakout Looming?
The 1-hour chart shows the Bollinger Bands contracting, signaling a volatility squeeze. This pattern often leads to significant price breakouts. The Relative Strength Index (RSI) is in oversold territory, suggesting a potential bullish reversal. With strong support at $0.0001 and increased buying interest, a short-term rebound is likely.
The SPONGE/USD market shows signs of potential bullish movement following a period of consolidation at $0.0001. The oversold RSI and contracting Bollinger Bands on the 1-hour chart further support this analysis. Traders should monitor the key resistance levels for potential breakout signals.
Buy $SPONGE!
The mind of an average crypto trader pic.twitter.com/87N2sFbz1j
— $SPONGE (@spongeoneth) March 25, 2025
Join the SPONGE community and get in on the next big crypto opportunity! Buy Sponge ($SPONGE) today!