$SPONGE (SPONGE/USD) Jumps Above $0.00005
Estimated Reading Time: 2 minutes
Don’t invest unless you’re prepared to lose all the money you invest. This is a high-risk investment and you are unlikely to be protected if something goes wrong. Take 2 minutes to learn more

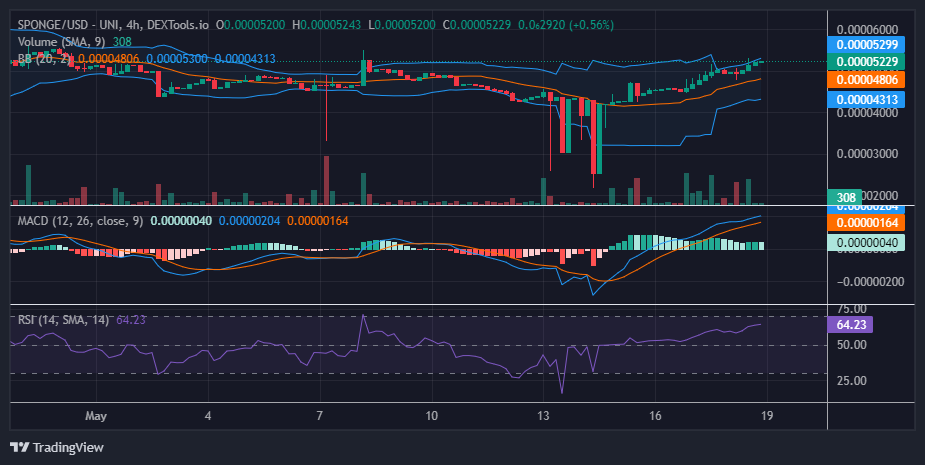
In the latest price analysis for the SPONGE/USD market, we observed a gradual ascent. The market diverged from the $0.00004 price level, surging to $0.000045. After a period of consolidation around this level, the market overcame bearish sentiment and has now surged above $0.00005. This $0.00005 price level, previously a bearish resistance, might become a support level in case of a retracement, given the ongoing strength of the bullish momentum.
Key Market Dynamics:
- Resistance Levels: $0.0010, $0.0011, and $0.0012.
- Support Levels: $0.000035, $0.000030, and $0.000025.
Delving into Technical Analysis for $SPONGE (SPONGE/USD)
The indicators are signaling bullish trends in the crypto market. The Bollinger Bands indicator is now illustrating an ascending price channel, with both the two standard deviations and the 20-day moving average following the upward trend. The Relative Strength Index (RSI) shows increasing market momentum, currently measuring 64. However, the Moving Average Convergence and Divergence (MACD) indicator suggests a potential correction, with a bearish presence noted around the $0.000053 price level. The latest MACD histogram, appearing in faded green, indicates a weakening in bullish momentum.
Insights from the 1-Hour Perspective
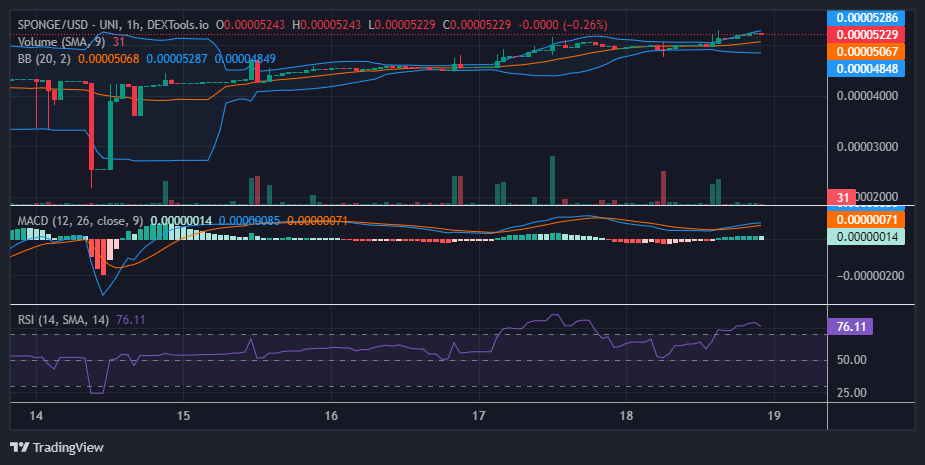
From the 1-hour chart perspective, the Relative Strength Index (RSI) indicates a correction from the overbought region. The SPONGE/USD bullish momentum had risen significantly, reaching an RSI level of 80, but is now declining as the market corrects itself. However, the actual price action remains flat due to the standoff between demand and supply at the $0.000053 level. Another consolidation phase may precede a strong market movement.
Buy SPONGE/USD!
There’s a new king in town 👑 🧽 #SpongeV2 #100x #MemeCoin pic.twitter.com/68Y1nNwTO3
— $SPONGE (@spongeoneth) May 17, 2024
Invest in the hottest and best meme coin. Buy Sponge ($SPONGE) today!