Dogecoin (DOGE/USD) Market Tests a Support, Making a Swing High
Estimated Reading Time: 3 minutes
Don’t invest unless you’re prepared to lose all the money you invest. This is a high-risk investment and you are unlikely to be protected if something goes wrong. Take 2 minutes to learn more
Dogecoin Price Prediction – September 11
Over a couple of sessions, a combination of declines has dominated the moves to the downside in the exchange of Dogecoin versus the US coin as the crypto market tests support around the point of $0.060, making a swing high.
As it can be seen, bears are not currently applying pressure to reliably break through the $0.060 level. The trading outlook has been steadily signaling the necessity to launch long position orders as it has been placed below a significant barrier line of $0.070; thus, doing so is now suggested. In a word, we advise that the majority of shorting activity be put on hold for a while.
DOGE/USD Market
Key Levels:
Resistance levels: $0.070, $0.075, $0.080
Support levels: $0.055, $0.050, $0.045
DOGE/USD – Daily Chart
The DOGE/USD daily showcases the crypto market testing a support trade spot of around $0.060, making a swing high.
The 50-day SMA indicator is at $0.0688, which is closely above the $0.0648 value line of the 14-day SMA indicator. Transaction activities between the two main market movers have been represented by smaller candlesticks, indicating that the market is yet to push out of a depression status. The stochastic oscillators have been in a mode of southbound bending and crossing from 36.90 to 23.62.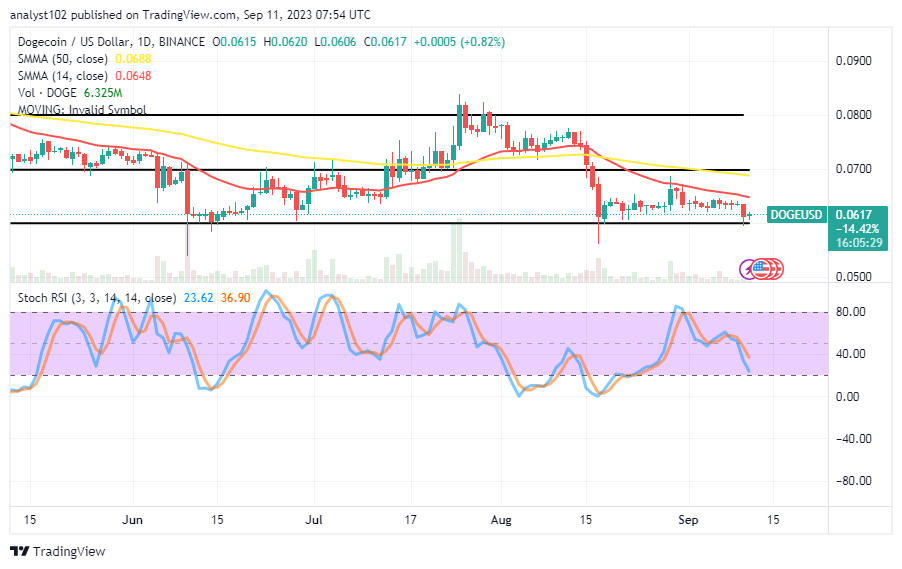
What real-time setting pattern in the DOGE/USD market is expected to be attained once the price reaches $0.060?
In about a couple of sessions, the DOGE/USD trade has been placed under a bearish setting that is likely not going to give reliability in seeing further lows, given that the crypto market tested a support spot of $0.060, making a swing high.
Buyers in the market for this crypto should nurse the same mind as long-term investors’ style of trading to be able to profit from the transaction while the law of gravity tends to play out in the direction of the upside afterward. Mustering of energy may be coming at a slow pace to implore the buyers to be patient toward gaining back the cycle.
Some attempts to fearfully push past the $0.060 line appear to have been unsuccessful. As a result, sellers needed to exercise caution when making moves that tended to approach the value line. The pivotal resistance trade zone has been constructed around the $0.070 line. A test of that area might be a better starting place for waiting for any potential indicators of a shorting position order.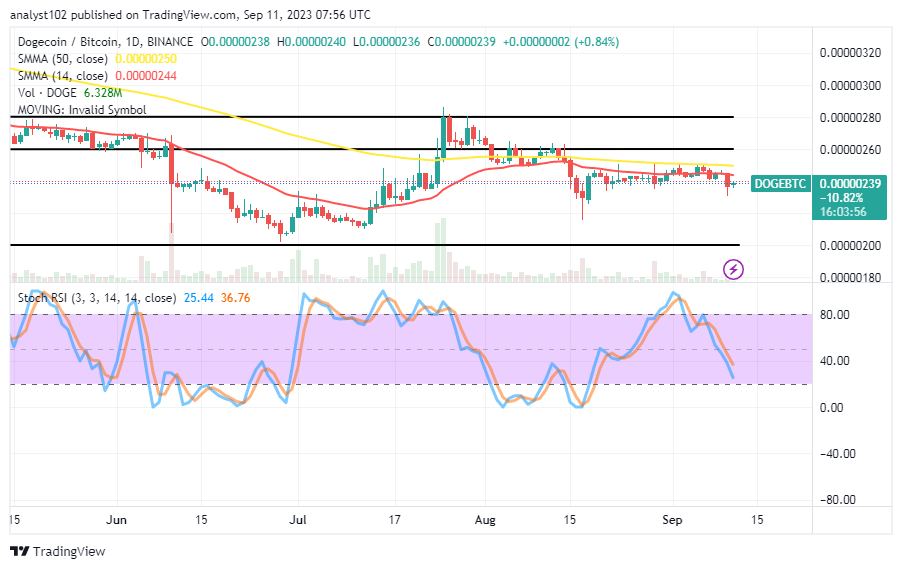
DOGE/BTC Price Analysis
In contrast, the declining velocity in the Dogecoin trade against Bitcoin has showcased that the pairing crypto market tests support below the trend lines of the moving averages, making a swing high.
Underneath the 50-day SMA trend line is the 14-day SMA trend line. They are both pointing in the direction of the eastern route. The stochastic oscillators are positioned between 36.76 and 25.44, crossing in a southerly direction. This suggests that the counter-currency would likely relax its stance to allow a rally to resume.
Note: Cryptosignals.org is not a financial advisor. Do your research before investing your funds in any financial asset or presented product or event. We are not responsible for your investing results.
You can purchase Lucky Block here. Buy LBLOCK