$SPONGE (SPONGE/USD) Market Buzzes as It Nears $0.000045 Threshold
Estimated Reading Time: 3 minutes
Don’t invest unless you’re prepared to lose all the money you invest. This is a high-risk investment and you are unlikely to be protected if something goes wrong. Take 2 minutes to learn more

Based on our recent analysis of the $SPONGE market, it is evident that the market has been in a prolonged consolidation phase. Notably, there has been consistent testing of support levels, particularly below the $0.00005 price threshold, which has served to fortify this support zone. However, recent developments have seen an increase in bearish pressure, leading to a weakening of bullish sentiment and a drift closer to the $0.000045 mark.
Given this downward shift in price towards $0.000045, traders should brace themselves for a potentially substantial upward movement in price.
Key Market Dynamics:
- Resistance Levels: $0.0010, $0.0011, and $0.0012.
- Support Levels: $0.000035, $0.000030, and $0.000025.
Delving into Technical Analysis for $SPONGE (SPONGE/USD):
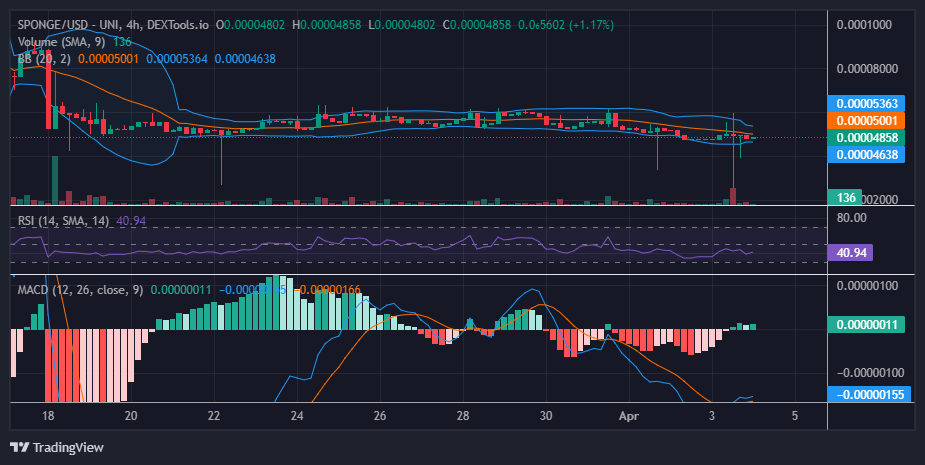
As indicated in our previous analysis, a dip in the $SPONGE market below the critical $0.00005 price threshold typically elicits a robust bullish response. Examining the 4-hour chart, we observed a notable surge in investor activity during the initial trading session of April 3, resulting in a significant price swing within that timeframe. However, despite this brief period of pronounced price fluctuation, mounting bearish pressure subsequently anchored the price below the pivotal $0.00005 level.
This recent development could potentially signify the nascent momentum of a bullish trend. Notably, the Bollinger Bands are converging, indicative of a sharp contraction in volatility. Such convergence often precedes a directional movement in price, suggesting a probable upward trajectory in the near future.
Insights from the 1-Hour Perspective:
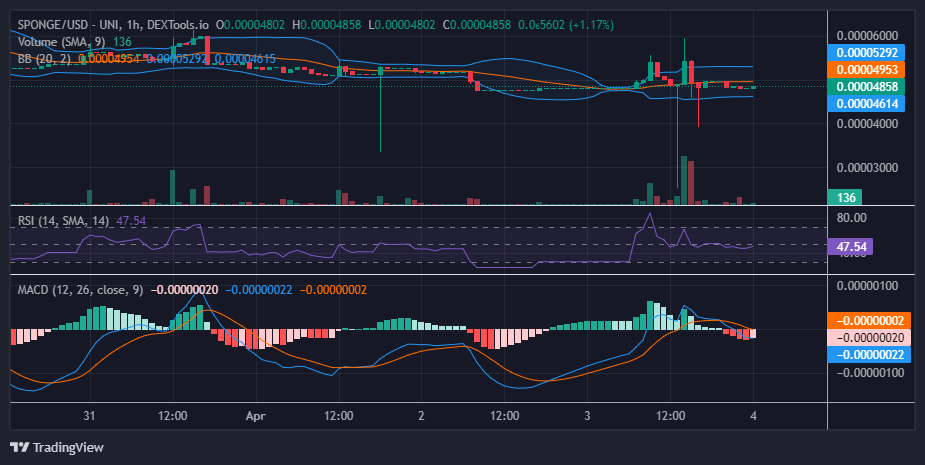
Based on the analysis of the 1-hour chart, a recent abrupt and substantial price swing has led to an expansion of the Bollinger Bands’ bandwidth. This expansion signifies heightened volatility, potentially paving the way for a breakout from the consolidation phase at $0.00048.
However, despite this increased volatility, the market price has displayed resilience by maintaining stability around $0.000048. Moreover, the momentum, as indicated by the Relative Strength Index, remains balanced around the midpoint.
Given the observation from this crypto signal, it is conceivable that the Bollinger Bands may begin to narrow once again. This narrowing suggests a potential reduction in volatility, which could prompt a further downward shift in the market towards $0.000045 before bullish sentiment reemerges.
I hope you didn’t overlook our next P2E game.
You didn’t forget about our upcoming #P2E game, did you? 👀🔥 $SPONGE #100xGem #Crypto #Alts pic.twitter.com/Uh3WyEmDxg
— $SPONGE (@spongeoneth) April 3, 2024
Invest in the hottest and best meme coin. Buy Sponge ($SPONGE) today!