$SPONGE (SPONGE/USD) Surges with a Significant Price Breakout in the Upward Direction
Estimated Reading Time: 3 minutes
Don’t invest unless you’re prepared to lose all the money you invest. This is a high-risk investment and you are unlikely to be protected if something goes wrong. Take 2 minutes to learn more
In our recent analysis of the $SPONGE market, we observed convergence between the support and resistance levels, with the price action maintaining a relatively steady state around $0.00082. This created increasing anticipation for a significant price breakout. In today’s session, the market has indeed experienced a breakout in an upward direction. This robust bullish movement has led to an escalation in volatility, strengthening the bearish side of the market.
Key Market Dynamics:
- Resistance Levels: $0.0010, $0.0011, and $0.0012.
- Support Levels: $0.000450, $0.00040, and $0.00035.
Comprehensive Technical Analysis for $SPONGE (SPONGE/USD):
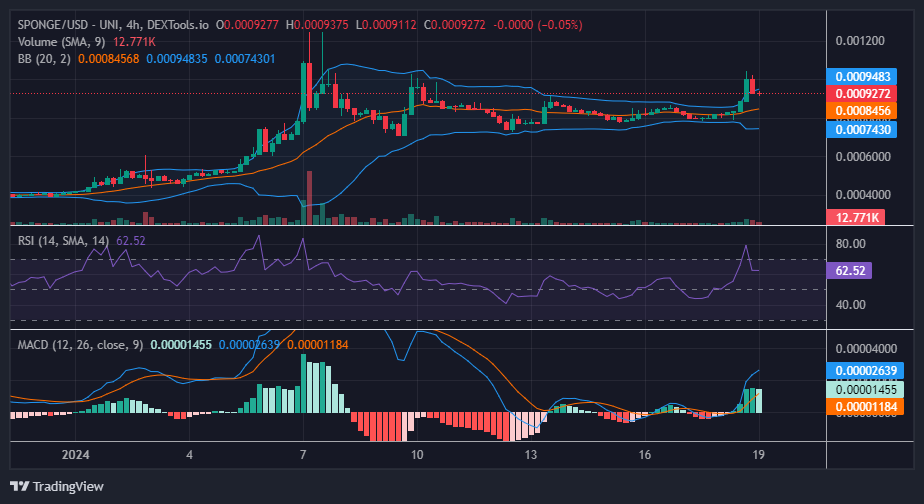
Upon examining the chart, a sudden surge in the price of $SPONGE is evident, attributed to substantial buying activity that propelled the price beyond the $0.0009 threshold. At this elevated level, indicators indicate an overbought condition in the $SPONGE market, as both the Bollinger Bands and the Relative Strength Index reflect this situation. The robust price surge is now undergoing a corrective phase, characterized by a notable price retracement driven by heightened volatility. Nevertheless, stability seems to be emerging around $0.009272.
From this level, a potential support level may materialize, originating from the $0.0009 price level, thereby aligning the market closer to its target of $0.0012.
Insights from the 1-Hour Perspective:
The increased volatility was particularly prominent when observed in the 1-hour timeframe. The Bollinger Bands exhibit a substantial bandwidth, and interestingly, despite this heightened volatility, both the two standard deviation curves and the 20-day moving average are exhibiting an upward trend, forming an ascending price channel. Upon analyzing the price action, it is evident that bullish intervention occurred around $0.00091, just above the 20-day moving average. This intervention at a higher level has allowed the bullish side to maintain control of the market, successfully steering the trend in their favor.
All it takes to get rewards is staking your $SPONGE!
💸🛌 Earn passive rewards just by staking your $SPONGE! 🤯
Join the #SpongeV2 takeover and enjoy our current APY of 300%+ 😎
Absorb the damp! 🧽💦🙌 #MemeCoin #Presale #Staking pic.twitter.com/OJ08MgMmWy
— $SPONGE (@spongeoneth) January 19, 2024
Invest in the hottest and best meme coin. Buy Sponge ($SPONGE) today!