$SPONGE (SPONGE/USD) Under Pressure: Bullish Resilience Persists
Estimated Reading Time: 3 minutes
Don’t invest unless you’re prepared to lose all the money you invest. This is a high-risk investment and you are unlikely to be protected if something goes wrong. Take 2 minutes to learn more

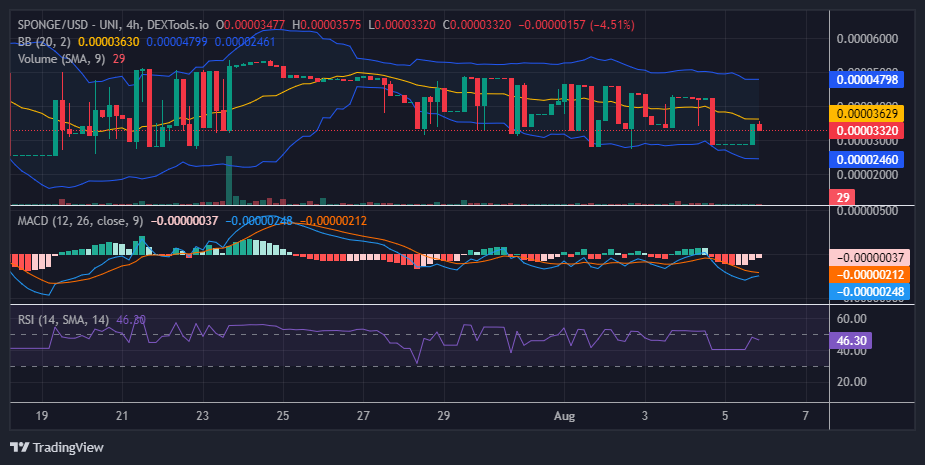
The $SPONGE market has exhibited significant volatility in recent trading sessions, with prices frequently testing the $0.00003 support level. While these trends indicate vulnerability to bearish pressure, the subsequent rapid recoveries, in this crypto signal, demonstrate underlying bullish sentiment. However, in recent trading sessions, the market has continued to show increasing bearish pressure, though the price always rebounds. Currently, bearish pressure has pushed the bulls to seek refuge at the $0.000028 price level. Although previous bullish support was around $0.00003, we anticipate a rally from the current level.
Key Market Dynamics:
- Resistance Levels: $0.0010, $0.0011, and $0.0012
- Support Levels: $0.000035, $0.000030, and $0.000025
$SPONGE (SPONGE/USD) Technical Outlook
The 4-hour chart reveals a market in equilibrium, with buyers and sellers engaged in a closely contested battle. Recent price action favors sellers, as evidenced by lower highs, forcing the bullish position at the $0.00003 price level to shift slightly downward. While this minor bearish trend may be due to broader market conditions, the usual bullish resilience observed in recent trading sessions suggests that bulls have not entirely given up. They may soon trigger a rally in the price action.
The bear market halted completely upon reaching the $0.000028 price level, as traders became bullishly biased. The Moving Average Convergence and Divergence (MACD) Indicator began to show signs of weakness in the reddish histograms. This underlying trend eventually led to a breakout, but the apparent formation of bearish resistance at the $0.000035 price level poses a concern for traders.
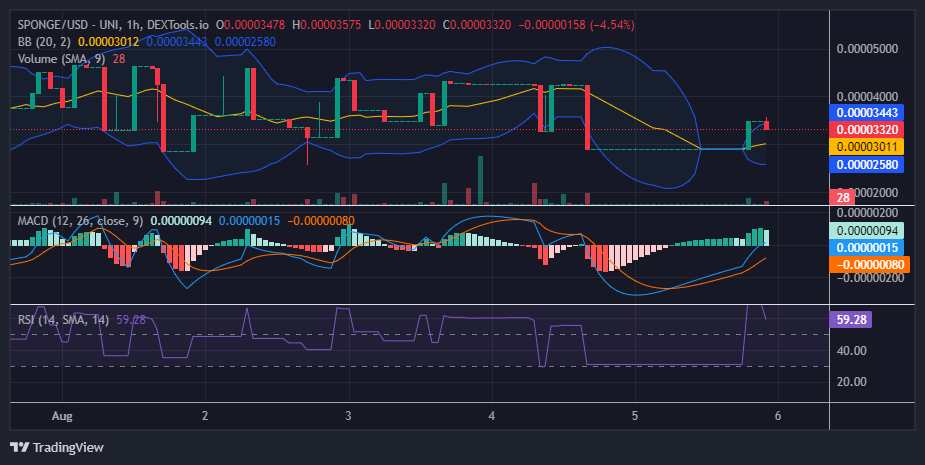
SPONGE/USD 1-Hour Chart Insights
Considering the Moving Average Convergence and Divergence (MACD) indicator from the 1-hour chart perspective, the indicator still signals a potential recovery. However, the latest bullish candlestick shows weakness in the bullish trend due to a sharp bearish candlestick, which highly signifies strong bearish pressure. Given that the bearish price movement was previously halted at the $0.000028 price level, it is likely that this level will once again act as strong support.
Buy SPONGE/USD!
Real recognises real 💦 $SPONGE pic.twitter.com/Ru8zdE0QfD
— $SPONGE (@spongeoneth) July 18, 2024
Join the SPONGE community and be part of the next big crypto sensation! Buy Sponge ($SPONGE) today!