SPONGE/USD: Is a Bullish Rebound on the Horizon?
Estimated Reading Time: 2 minutes
Don’t invest unless you’re prepared to lose all the money you invest. This is a high-risk investment and you are unlikely to be protected if something goes wrong. Take 2 minutes to learn more

Despite a recent dip below the key $0.00009 support level, SPONGE/USD is showing signs that a potential rebound could be imminent. While bulls were unable to hold their ground, pushing the price down to $0.000085, a closer look at the technical indicators suggests that the market may be gearing up for an upward move.
Key Levels to Watch
- Resistance: $0.000115, $0.000120, $0.000130
- Support: $0.000085, $0.000080, $0.000075
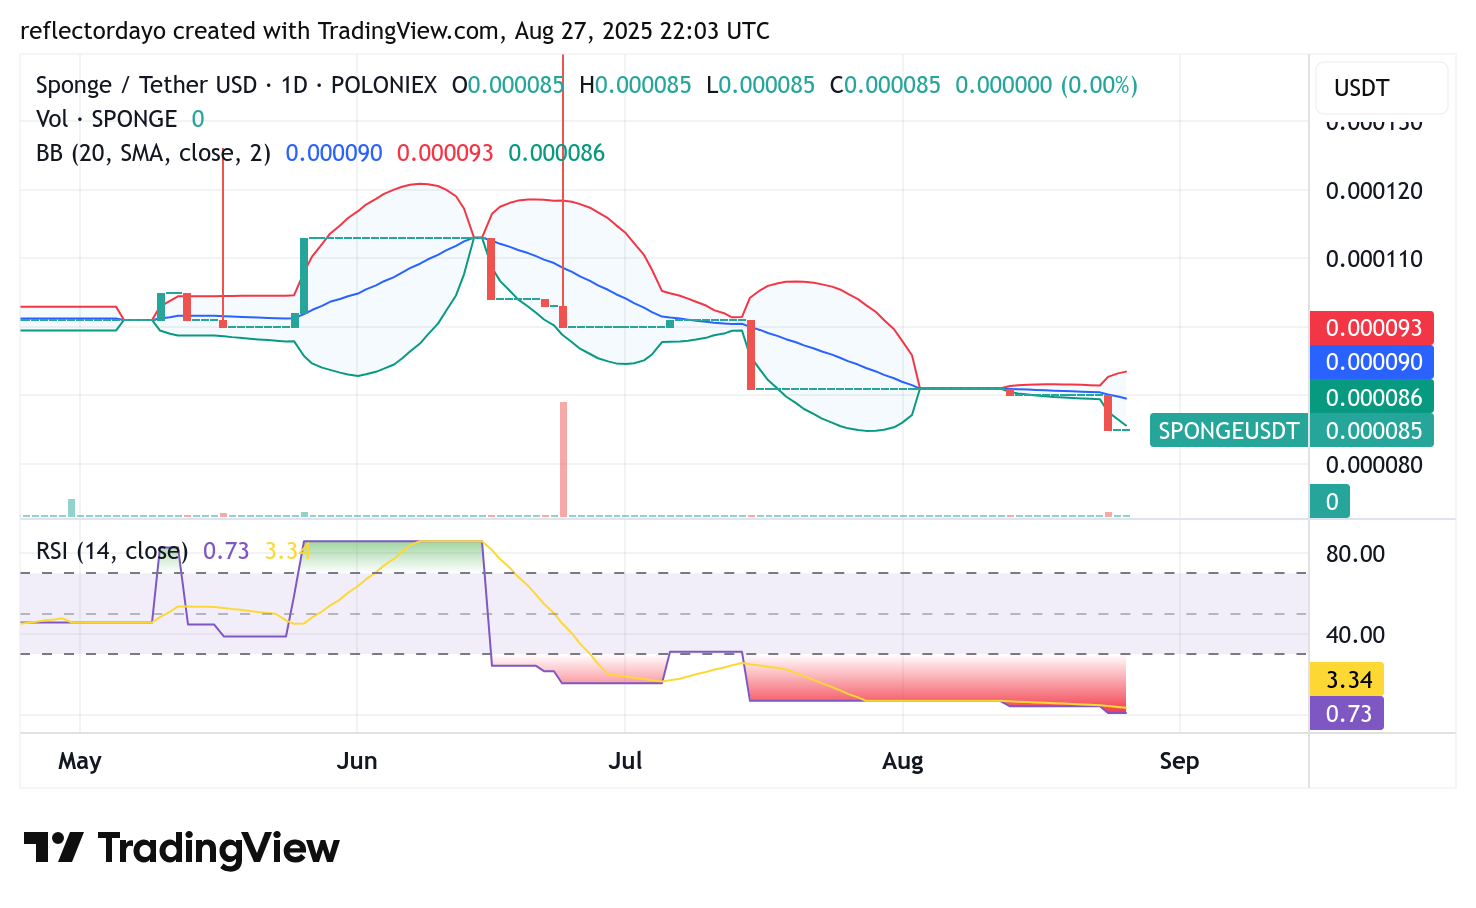
SPONGE/USD Daily Chart: Oversold Conditions Point to a Potential Bounce
The daily chart for SPONGE/USD indicates that the market is in a prime position for a reversal. The Relative Strength Index (RSI) has moved deeper into oversold territory, a clear sign of significant selling pressure. Historically, these conditions often lead to a responsive upward correction. The increased volatility also hints that a bounce may be on the way, potentially offering an attractive entry point for traders.
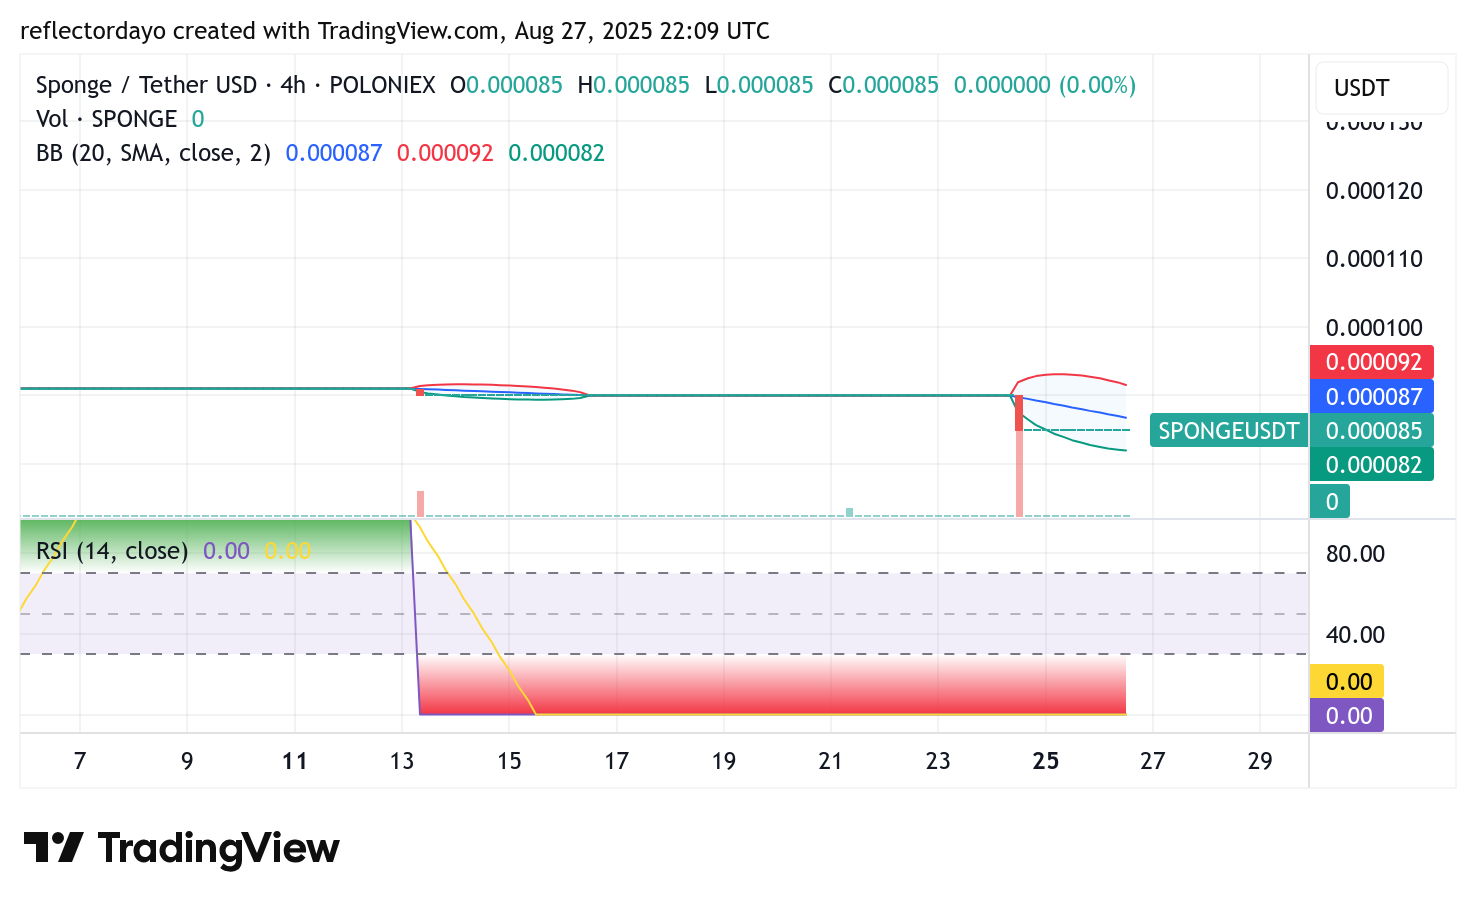
$SPONGE 4-Hour Chart: A Surge in Volume Could Signal a Reversal
On the 4-hour chart, recent trading sessions have seen a significant increase in volume, mainly driven by the selloff that followed the break below $0.00009. This spike in activity may have created a temporary supply and demand imbalance. If buyers step in and seize this opportunity, it could trigger a strong rebound, potentially pushing the price back above the $0.00009 level.
Buy SPONGE/USD!
LOADING ⚡️⚡️⚡️ pic.twitter.com/DrMAEfgCM3
— $SPONGE (@spongeoneth) August 23, 2025
Join the SPONGE community and get in on the next big crypto opportunity! Buy Sponge ($SPONGE) today