SPONGE/USD ($SPONGE): Bullish Rejection at $0.000140 – What’s Next?
Estimated Reading Time: 4 minutes
Don’t invest unless you’re prepared to lose all the money you invest. This is a high-risk investment and you are unlikely to be protected if something goes wrong. Take 2 minutes to learn more

The recent trajectory of the $SPONGE market has been a rollercoaster of bullish intent and significant resistance. After strong intervention by buyers around the $0.000104 and $0.000103 support levels, market sentiment leaned towards a substantial upward move, and the price delivered a compelling rally.
In a remarkable display of buying power, SPONGE/USD decisively exited its consolidation phase near $0.000103, soaring to an intraday high of $0.000140. This impressive surge was backed by a notable uptick in market volatility, underscoring the conviction behind the bullish push.
However, the advance encountered formidable opposition at the $0.000140 threshold. This price point proved to be a strong ceiling, triggering an aggressive wave of selling that subsequently pushed the price back towards the $0.000100 vicinity. The rapid rejection from this peak highlights the persistent presence of sellers and suggests that the bullish momentum struggles to sustain itself at elevated levels.
Moving forward, the ability of crypto signal to stabilize around the $0.000100 support will be paramount for preserving its bullish market structure. A failure to hold this crucial level could open the door to deeper corrections. Conversely, a renewed assault on the $0.000140 resistance could potentially pave the way for a decisive breakout.
Key Price Levels to Monitor:
- Resistance: $0.000115, $0.000120, $0.000130
- Support: $0.000090, $0.000085, $0.000080
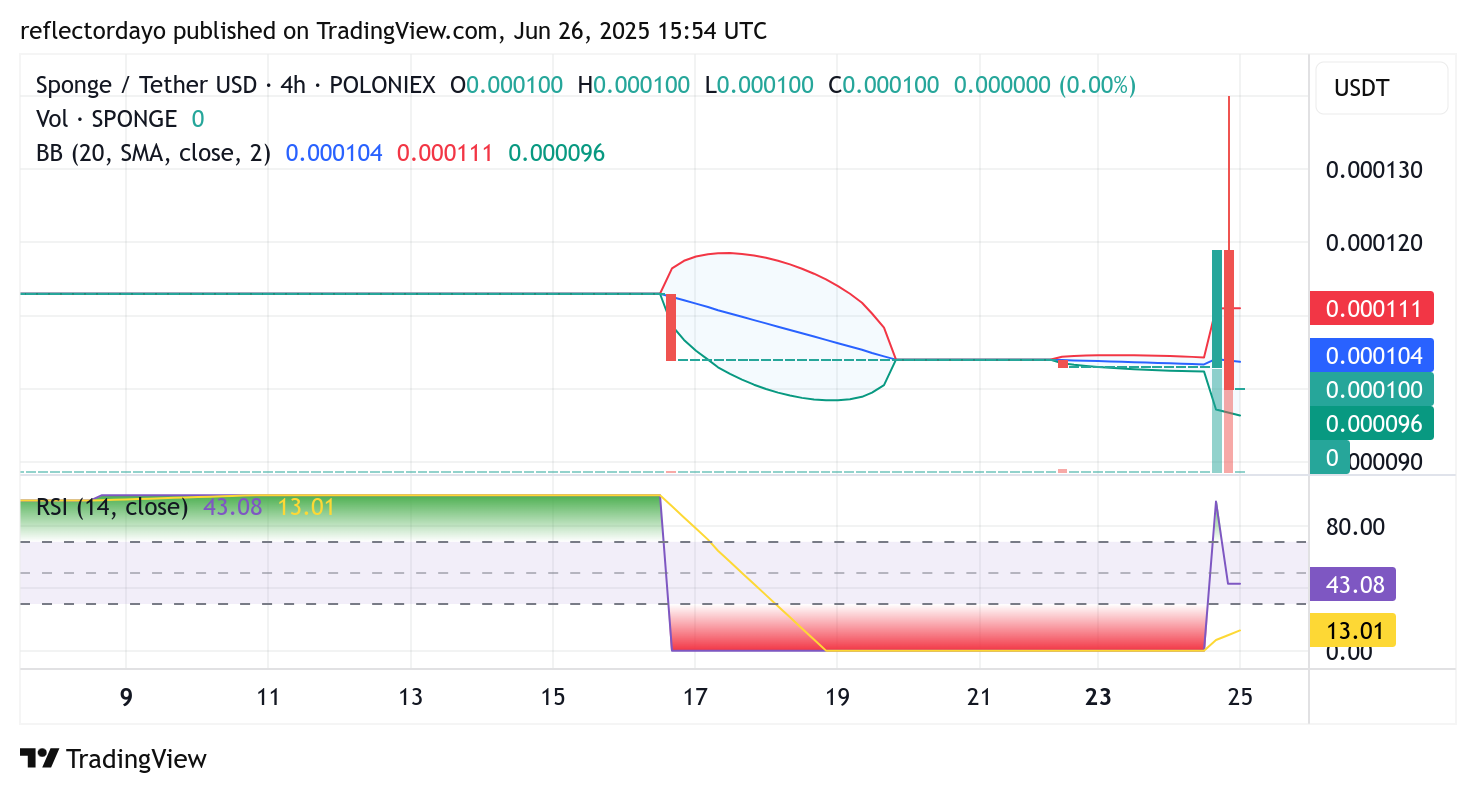
$SPONGE 4-Hour Chart: Post-Breakout Retracement and Key Support Re-evaluation
The $SPONGE market recently witnessed an explosive upward movement, successfully breaking free from an extended period of consolidation around the $0.000103 mark. This significant rally, underpinned by a notable surge in trading volume, offered a credible signal of a market shift and provided early entrants with substantial profit opportunities.
However, the momentum proved unsustainable, with profit-taking ensuing and allowing bears to reclaim some ground. Consequently, the price has since retraced, effectively resetting the market structure by returning to the critical support zone at $0.000100.
This $0.000100 level is now under intense scrutiny. It stands as a pivotal point, potentially serving as a launchpad for renewed bullish enthusiasm should buying interest re-emerge. Traders are advised to closely observe this zone for signs of accumulation or a reversal, as it could present fresh entry opportunities if the market regains its upward trajectory.
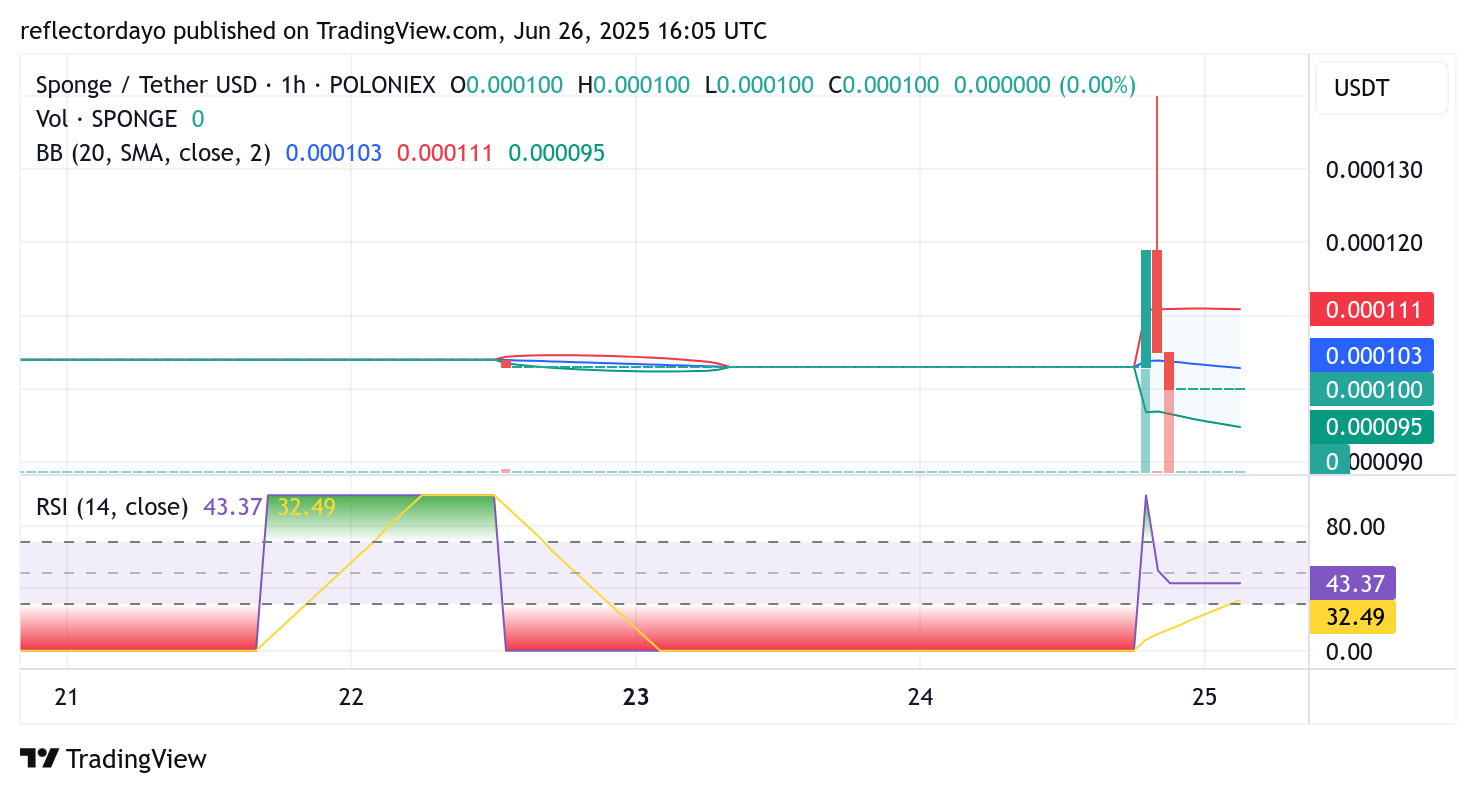
SPONGE/USD 1-Hour Chart: $0.0001 Support Under Scrutiny for Rebound Potential
A granular examination of the 1-hour chart reveals SPONGE/USD in a consolidation phase at the vital $0.000100 support level. This zone has historically acted as a springboard for previous bullish surges, imbuing it with significant technical importance.
Given its historical efficacy, the likelihood of a bullish rebound originating from this area remains high. Early indications of accumulation are already visible, suggesting that market participants may be strategically positioning themselves in anticipation of another upward price swing.
Should buying pressure intensify at this support, the market could soon attempt another breakout towards higher price levels.
Buy SPONGE/USD!
Bro selling everything to buy the dip pic.twitter.com/z2QVtqR8rt
— $SPONGE (@spongeoneth) June 19, 2025
Join the SPONGE community and get in on the next big crypto opportunity! Buy Sponge ($SPONGE) today