SPONGE/USD ($SPONGE) Rejected at the $0.000140 Resistance Level
Estimated Reading Time: 3 minutes
Don’t invest unless you’re prepared to lose all the money you invest. This is a high-risk investment and you are unlikely to be protected if something goes wrong. Take 2 minutes to learn more

The recent performance of the SPONGE/USD market has been marked by a notable bullish intervention around the $0.000104 and $0.000103 support levels. Following this strong defense, market expectations tilted towards a potential breakout and upward continuation—and the price action delivered.
During the latest trading session, SPONGE/USD successfully broke out of its consolidation zone around $0.000103, rallying sharply to reach a high of $0.000140. This bullish move was accompanied by a significant increase in market volatility, suggesting strong buying momentum.
However, the surge was met with heavy resistance at the $0.000140 level. This resistance zone triggered a wave of selling pressure, allowing the bears to push the price back down toward the $0.000100 area. The swift rejection at the local high highlights the presence of aggressive sellers and the fragility of bullish momentum at higher levels.
Going forward, price stability around the $0.000100 support will be critical for maintaining bullish structure. A failure to hold this level could expose the market to deeper corrections, while another retest of the $0.000140 resistance may open the door for a potential breakout.
Key Technical Zones to Watch
- Resistance Levels: $0.000115, $0.000120, $0.000130
- Support Levels: $0.000090, $0.000085, $0.000080

SPONGE/USD 4-hour chart: Price Retraces After Explosive Breakout
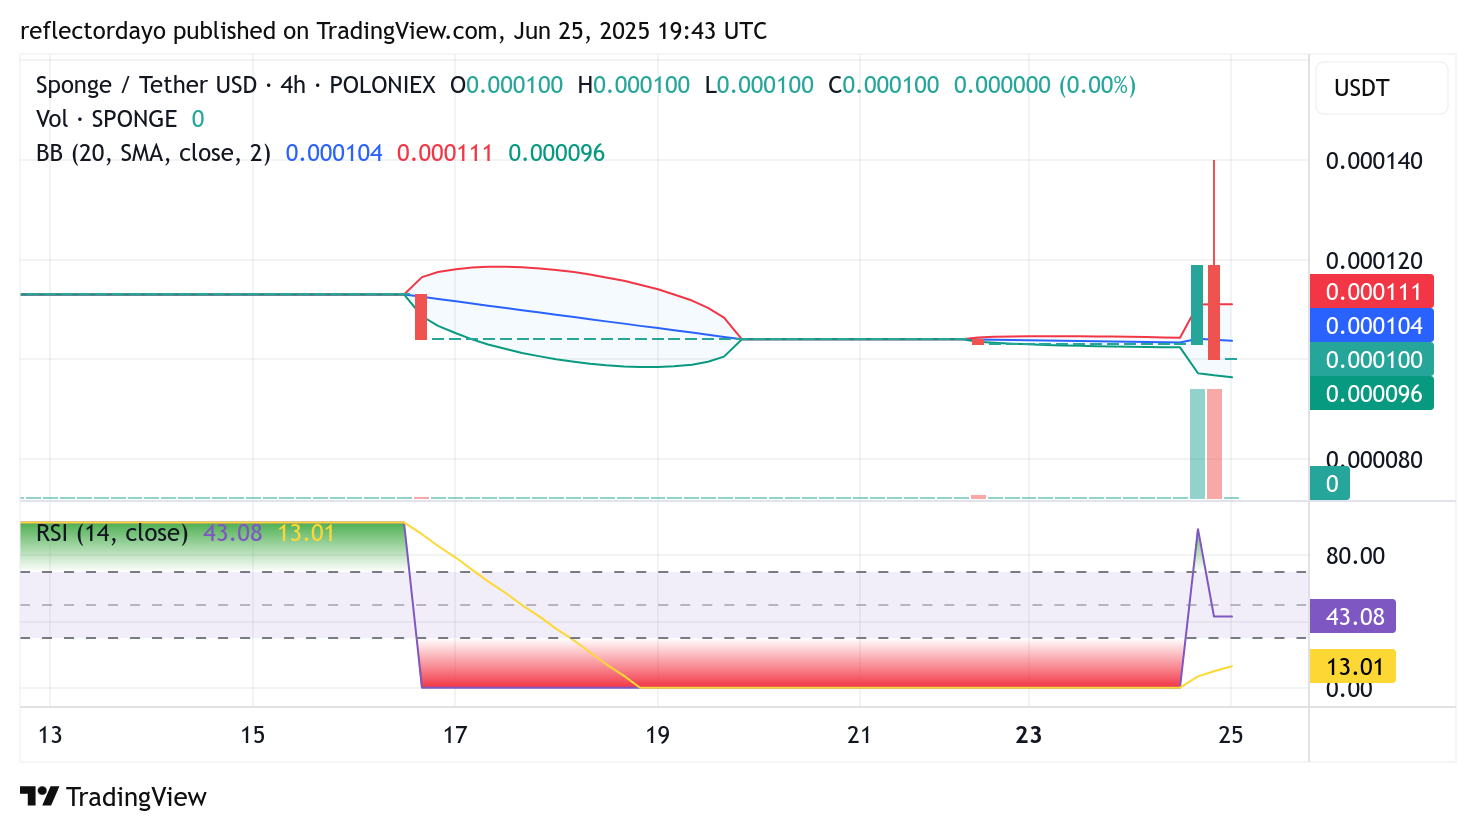
The SPONGE/USD market recently experienced a significant price surge, breaking out of a prolonged consolidation phase around the $0.000103 level. In a strong show of bullish momentum, the price spiked sharply, supported by a notable increase in trading volume—adding credibility to the breakout move.
This explosive rally provided early entrants with a window of substantial profit, but the upward momentum was short-lived. A wave of profit-taking has since set in, weakening the bullish advance and allowing bears to regain some control. As a result, the price has retraced back to the key support zone at $0.000100—essentially resetting the market structure.
This $0.000100 level is now a crucial area to watch. It represents a potential launchpad for another bullish bounce if buying interest resurfaces. Traders should closely monitor this zone, as it may offer a fresh opportunity for re-entry if the market regains upward traction.
SPONGE/USD 1-Hour Chart: Price Stabilizes at Key $0.0001 Support
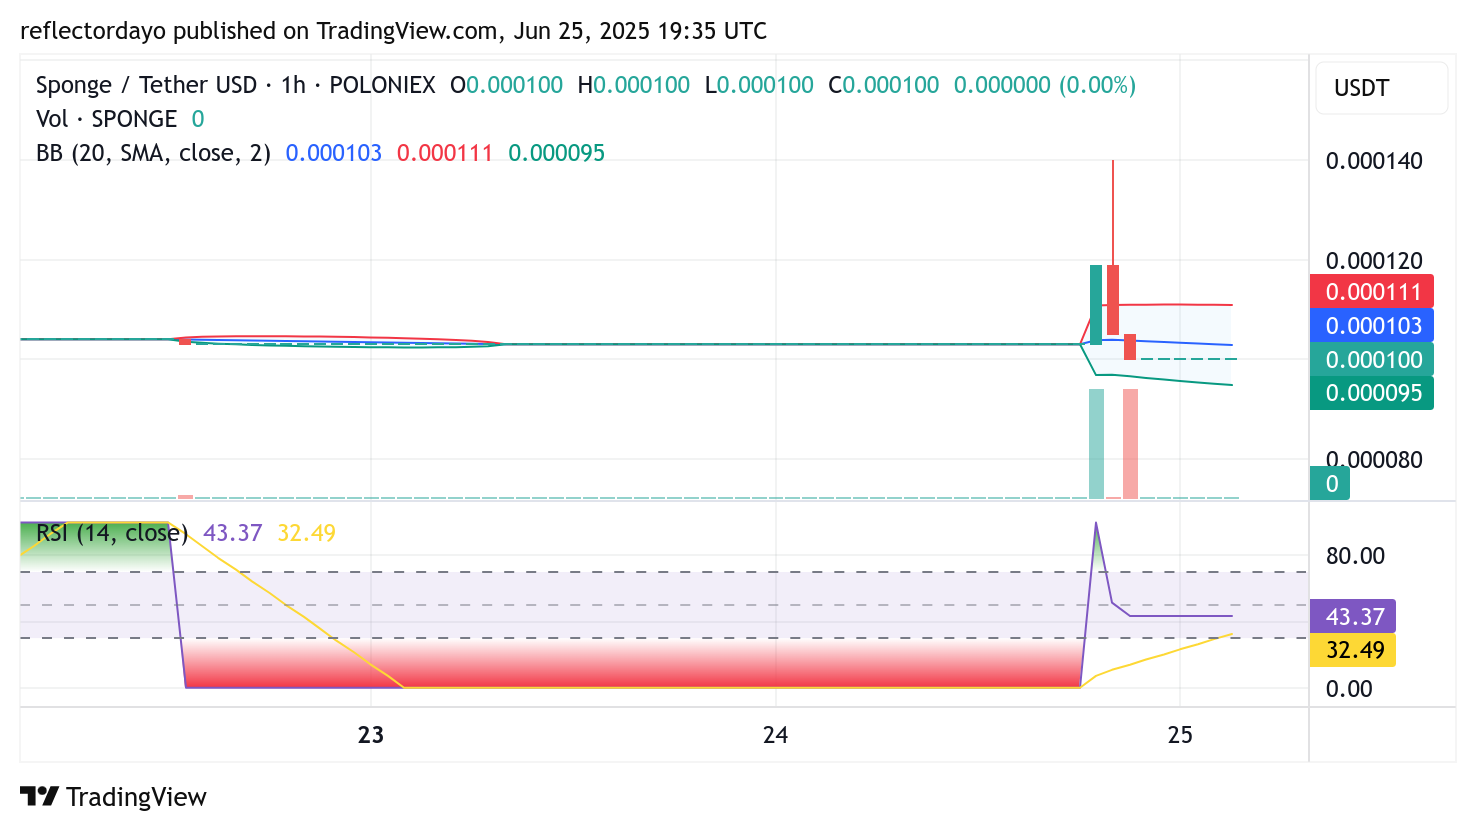
A closer look at the 1-hour chart reveals that SPONGE/USD is currently consolidating at the critical support level of $0.000100—a zone that previously served as the launchpad for recent bullish surges.
Given the historical significance of this level, the probability of a bullish rebound from this area remains high. Early signs of accumulation are already visible, suggesting that investors may be positioning themselves in anticipation of another upward move.
If buying pressure strengthens at this support, we could soon witness a fresh breakout attempt to the upside.
Bro selling everything to buy the dip pic.twitter.com/z2QVtqR8rt
— $SPONGE (@spongeoneth) June 19, 2025
Join the SPONGE community and get in on the next big crypto opportunity! Buy Sponge ($SPONGE) today