Sponge/USD ($SPONGE) Bulls Regroup Below $0.0001015
Estimated Reading Time: 3 minutes
Don’t invest unless you’re prepared to lose all the money you invest. This is a high-risk investment and you are unlikely to be protected if something goes wrong. Take 2 minutes to learn more
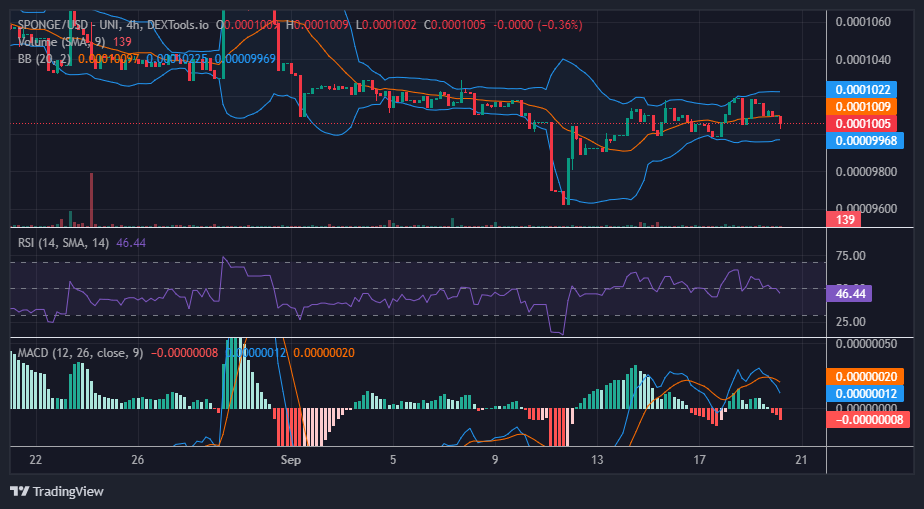
Over the past few days, the SPONGE/USD market has shown notable signs of potential bullish momentum. The price action has formed an ascending wedge triangle pattern, characterized by a series of higher lows, while the resistance level at $0.0001015 has remained steadfast. This pattern suggests an impending breakout.
Contrary to initial expectations, the bullish market has encountered resistance and subsequently retraced to the $0.0001005 level, establishing a marginally higher support level. This support level now resides slightly above the critical price threshold of $0.0001000.
Key Levels
- Resistance: $0.000115, $0.000120, and $0.000125.
- Support: $0.00010, $0.000090, and $0.000080.
Sponge (SPONGE/USD) Price Analysis: Insights from Indicators
The recent bullish activity around the resistance level has impacted the upper standard deviation curve of the Bollinger Bands indicator. This indicates an increase in volatility, often a precursor to a significant SPONGE/USD price movement. The upward pressure on the upper band supports the notion of an imminent breakout.
Currently, the RSI stands at 46. While it is not in overbought territory, it is positioned in a range that allows for potential upward movement. This suggests that there is room for the price to climb before encountering significant resistance.

$SPONGE Short-Term Outlook: 1-Hour Chart
The SPONGE/USD historical bullish support at $0.00010 has proven to be a reliable level, and it is currently acting as a regrouping point for the bulls. This reinforces the notion that there is a strong foundation for further upward movement.
In light of the ascending wedge triangle pattern, the Bollinger Bands’ upper standard deviation curve, and the supportive RSI level, there is a compelling case for an eventual breakout above the $0.0001015 resistance level. While a short-term correction is possible, the overall trend remains positive, supported by the historical bullish support at $0.00010.
Take advantage of the SPONGE/USD airdrop before the opportunity closes.
🧽 $SPONGE Announcement Time!🧽
As we’re nearing the end of the phenomenal $SPONGE #Airdrop!🎁
We’ve got three secret surprises on the horizon!🤫
Can you guess what they are?🤔
Don’t miss out, join the #SPONGE Airdrop and soak up all the damp now!💰 https://t.co/lzRhjW4oLL pic.twitter.com/OS3SwpCx9J
— $SPONGE (@spongeoneth) September 20, 2023
Invest in the hottest and best meme coin. Buy Sponge ($SPONGE) today!