SPONGE/USD ($SPONGE) Holds Firm Near $0.00007—A Relief Rally Might Be on the Horizon
Estimated Reading Time: 2 minutes
Don’t invest unless you’re prepared to lose all the money you invest. This is a high-risk investment and you are unlikely to be protected if something goes wrong. Take 2 minutes to learn more

The $SPONGE token has continued to stabilize around the $0.00007 level after dipping from approximately $0.000078. The appearance of multiple doji candlesticks signals market indecision, indicating that bearish momentum is weakening and a potential rebound may be forming. If the $0.00007 support holds, a short-term bullish move could follow. However, a breakdown below this level might trigger a deeper correction—though this seems unlikely given the market’s already oversold condition.
Key Levels to Watch:
- Resistance: $0.000115, $0.000120, $0.000130
- Support: $0.000075, $0.000070, $0.000065
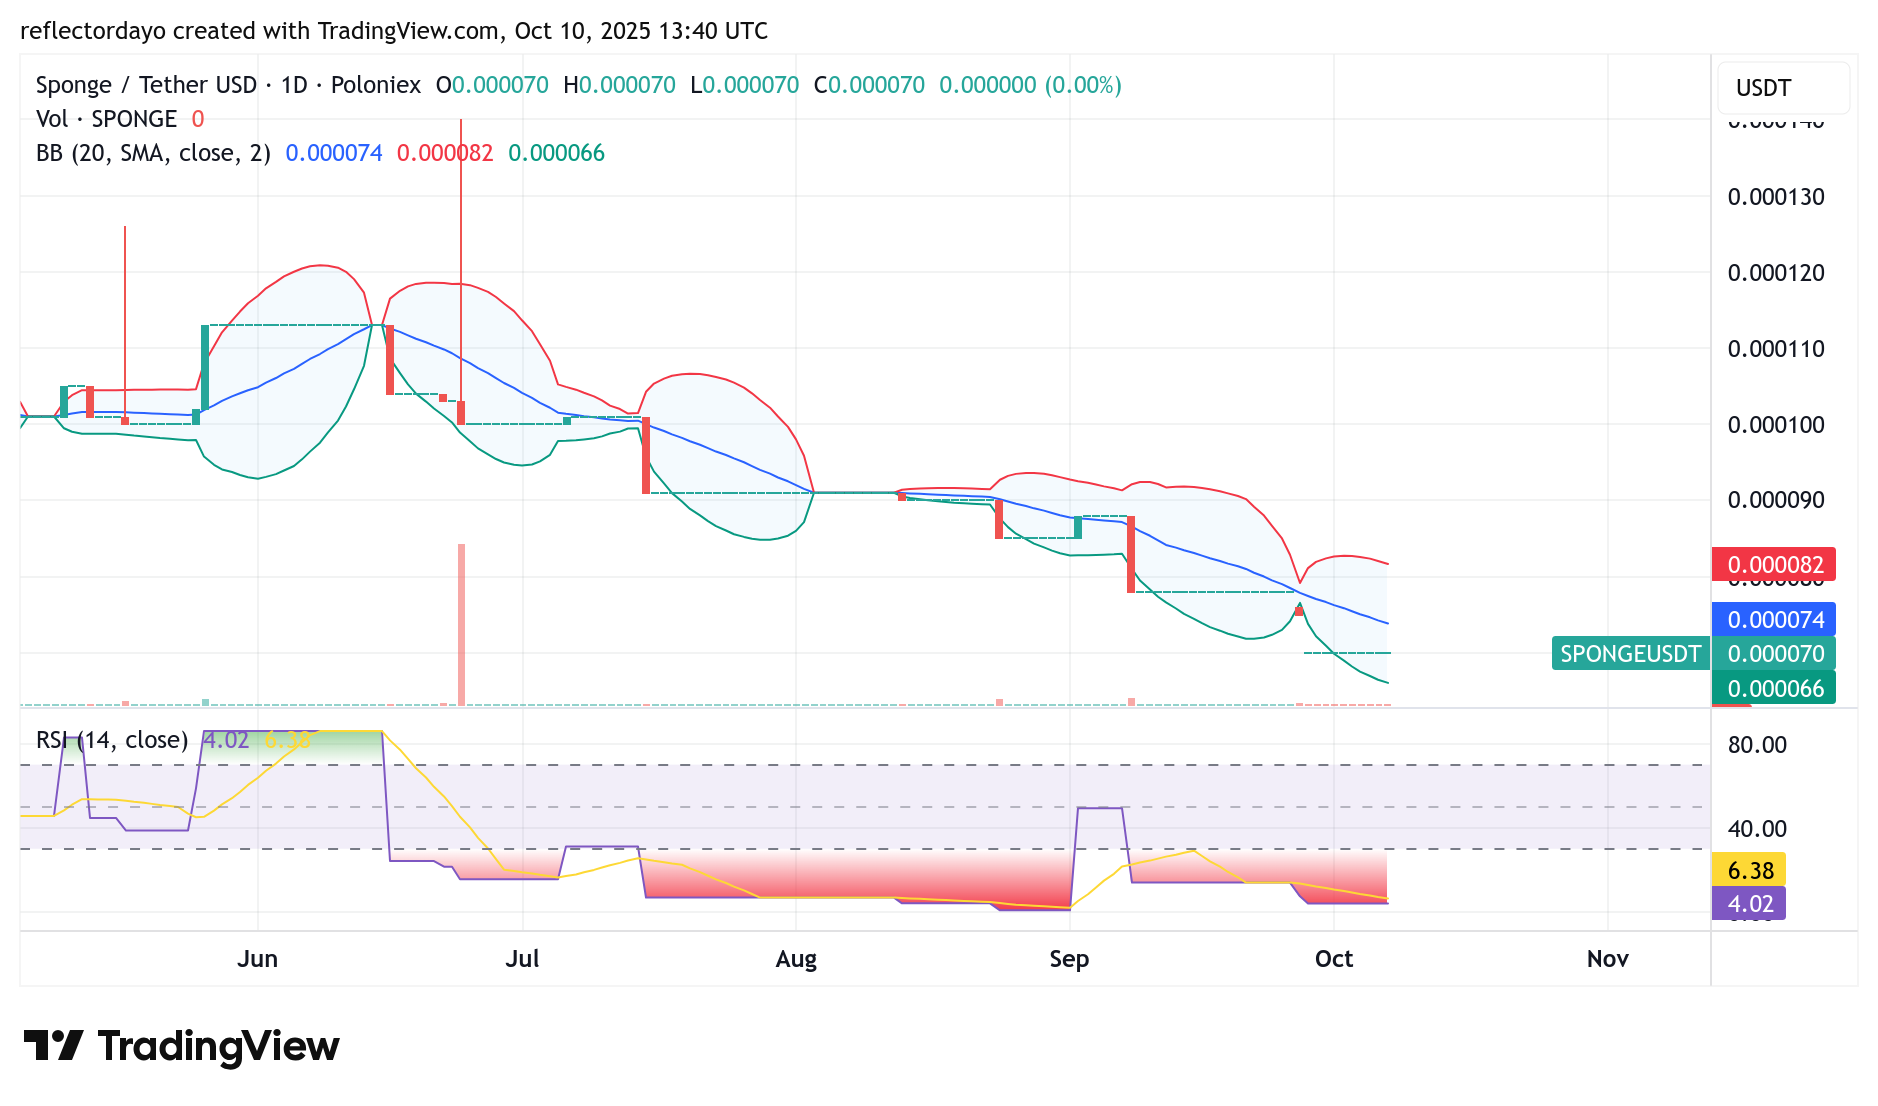
SPONGE/USD Daily Chart: Oversold Readings Point to a Potential Reversal
A further breakdown in the market appears unlikely, as indicators show that $SPONGE is already in heavily oversold territory. Traders may begin viewing this as a buying opportunity, anticipating an imminent breakout. Indeed, now could be an ideal time to “buy the dip,” with the potential for an upward surge on the horizon.
SPONGE/USD remains deeply oversold on the daily chart, with the RSI hovering around 4—a level that often precedes a rebound. This technical setup suggests a possible short-term recovery as buyers capitalize on discounted prices. If momentum and trading volume strengthen in October, market sentiment could shift from bearish fatigue to renewed optimism.
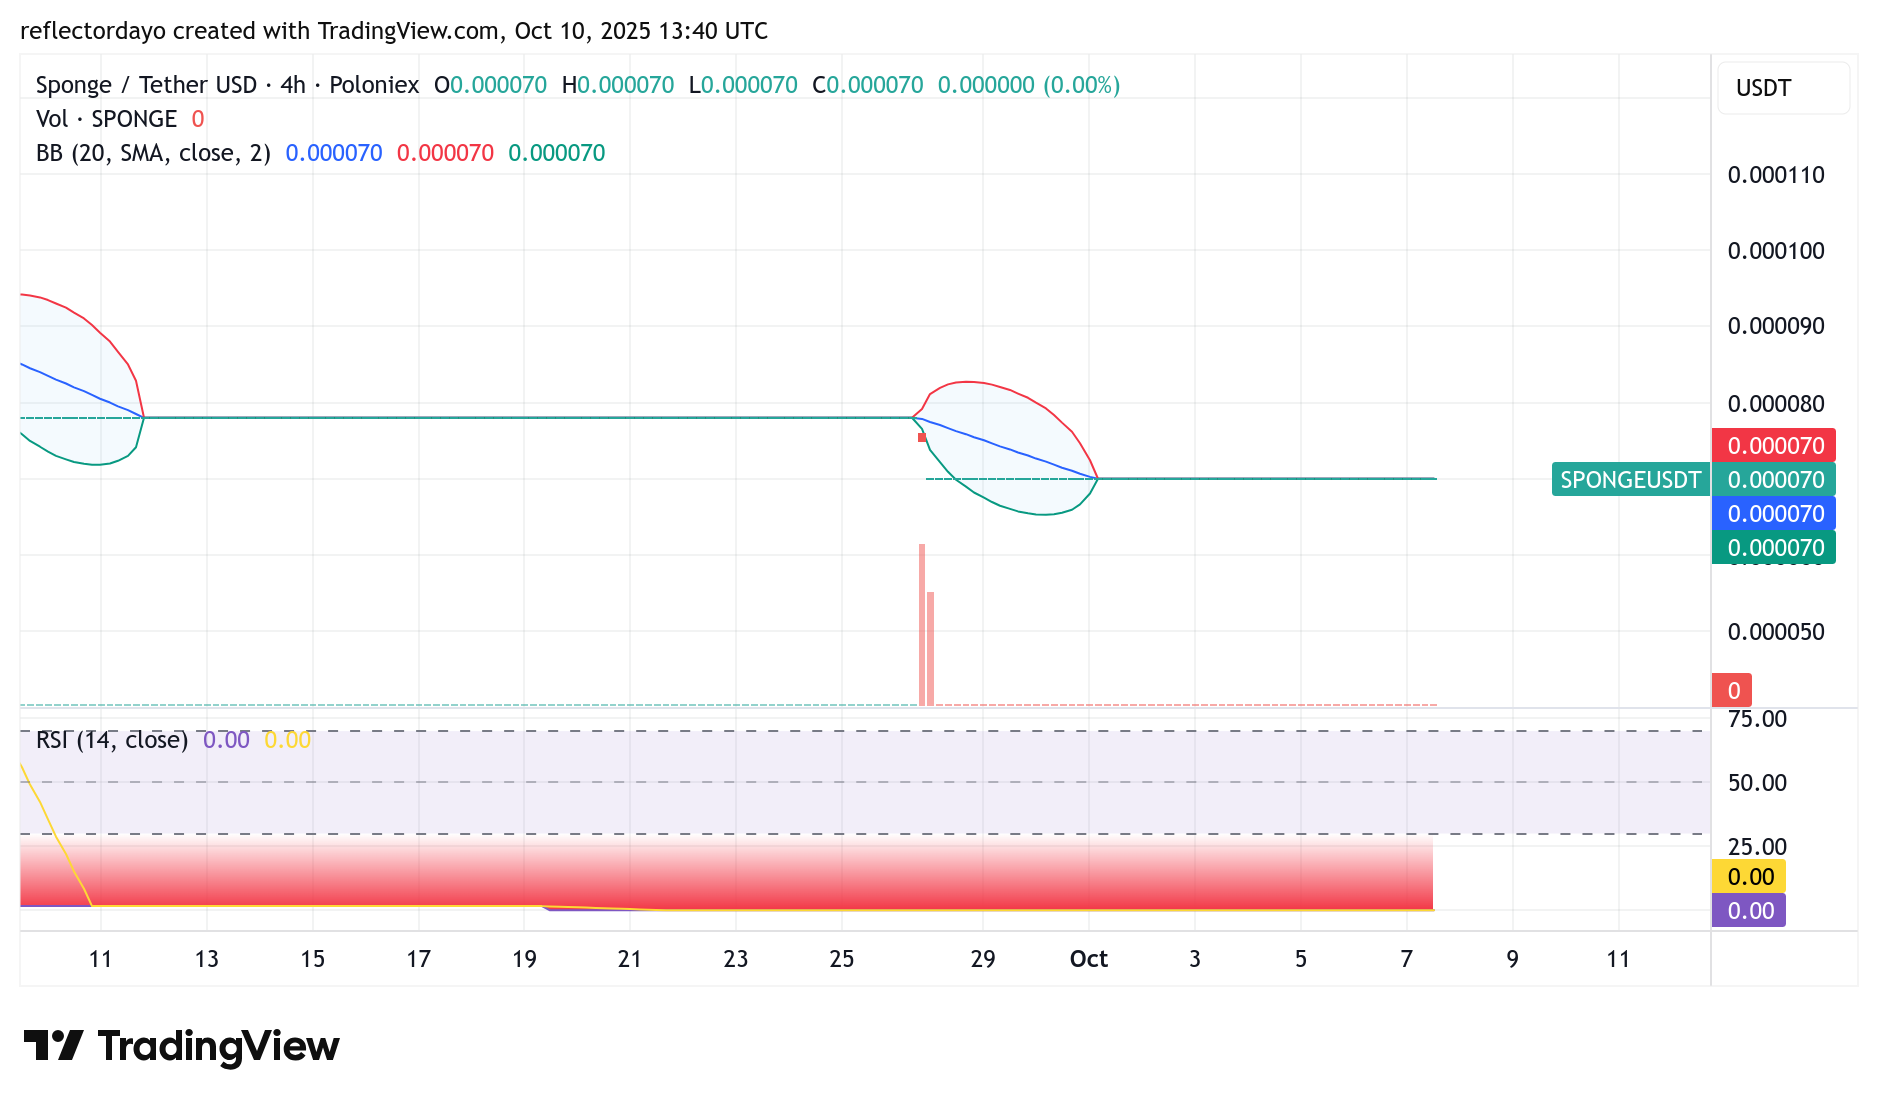
SPONGE/USD 4-Hour Chart: Tight Range Suggests a Breakout Is Brewing
On the 4-hour chart, SPONGE/USD is trading within a tight range as the Bollinger Bands narrow, signaling a possible breakout ahead. Declining bearish volume suggests weakening selling pressure and early bullish accumulation. A breakout above the range could see targets near $0.000078 and $0.000115, while failure to do so may keep the pair consolidating until new momentum arises.
Buy $SPONGE!
GEN Z DAMP 💦💦 pic.twitter.com/ZsQ0WB4ok4
— $SPONGE (@spongeoneth) October 8, 2025
Join the SPONGE community and get in on the next big crypto opportunity! Buy Sponge ($SPONGE) today