UNUS SED LEO Price Prediction: LEO/USD Resumes Higher, Price Trades at $4.19 Level
Estimated Reading Time: 3 minutes
Don’t invest unless you’re prepared to lose all the money you invest. This is a high-risk investment and you are unlikely to be protected if something goes wrong. Take 2 minutes to learn more
UNUS SED LEO Price Prediction – July 13
Looking at the daily chart, the UNUS SED LEO (LEO) price prediction shows positive signs, and it is likely to accelerate further higher.
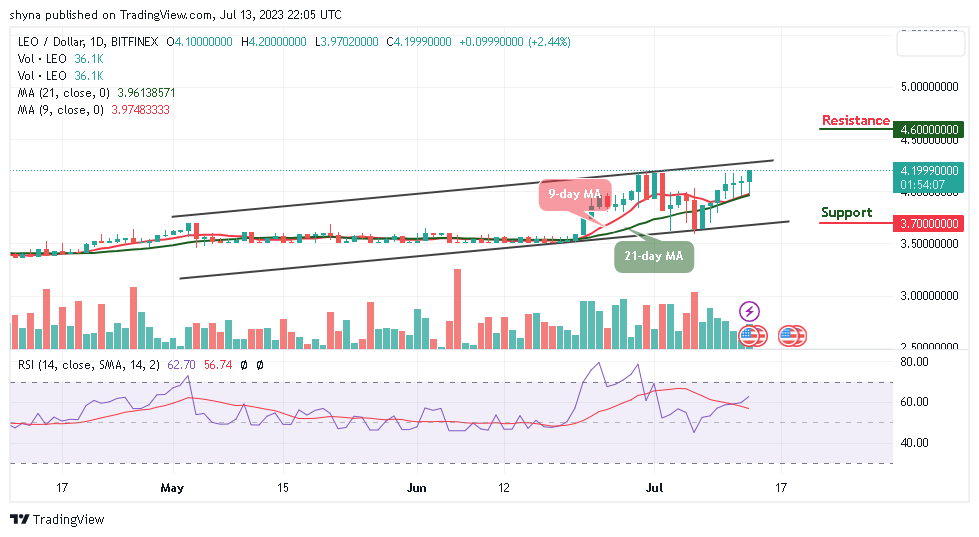
LEO/USD Long-term Trend: Bullish (Daily Chart)
Key levels:
Resistance Levels: $4.60, $4.80, $5.00
Support Levels: $3.70, $3.50, $3.30
According to the daily chart, LEO/USD touches the daily high at $4.20. The coin is trading well above the 9-day and 21-day moving averages at $4.19. Moreover, the UNUS SED LEO price is moving to cross above the upper boundary of the channel.
UNUS SED LEO Price Prediction: Where is UNUS SED LEO Price Going Next?
At the moment, the UNUS SED LEO price is trading comfortably toward the upper boundary of the channel as the price establishes a new bullish signal. At the moment, one could say that the long-term outlook favors the bulls, giving the daily close produced a large bullish engulfing candle with eyes now set on the daily resistances at $4.60, $4.80, and $5.00 respectively.
On the contrary, any bearish cross below the moving averages could lead to declines in critical support. However, in case LEO drops and touches the low of $3.90 support again, then the coin can rely on the long-term support levels at $3.90, $3.50, and $3.30. Moreover, the technical indicator Relative Strength Index (14) now moves above the 60-level, suggesting more bullish signals.
LEO/USD Medium-term Trend: Ranging (4H Chart)
According to the 4-hour chart, the UNUS SED LEO price is trading above the 9-day and 21-day moving averages at $4.19. However, today’s price move happens to be an impressive one as LEO/USD could maintain its bullish movement. Nonetheless, the technical indicator Relative Strength Index (14) may move sideways before creating additional gains.
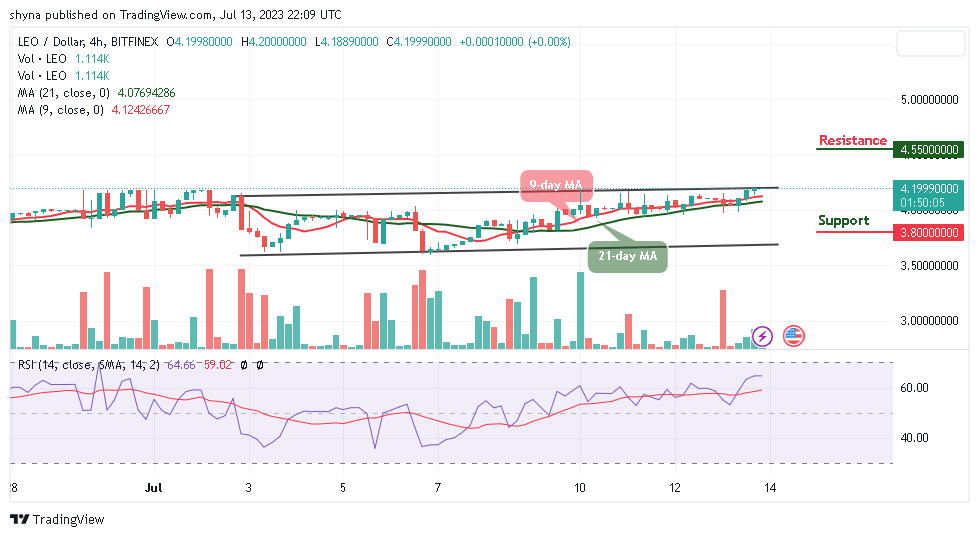
Meanwhile, LEO may take a downward move if the bulls fail to push the price higher, and the coin may breach below the 9-day and 21-day moving averages, which could reach another support at $3.80 and below. Nevertheless, if the bulls find a decent resistance level above the upper boundary of the channel, the coin hit the resistance level of $4.50 and above.
Place winning LEO trades with us. Get LEO here