SPONGE/USD ($SPONGE) Indicators Point to Emerging Trend Potential
Estimated Reading Time: 2 minutes
Don’t invest unless you’re prepared to lose all the money you invest. This is a high-risk investment and you are unlikely to be protected if something goes wrong. Take 2 minutes to learn more

Analyzing the daily chart reveals that key technical indicators are starting to signal the early formation of a potential new trend in the $SPONGE market. Bulls have consistently held the crucial $0.0001 support zone, maintaining a tight consolidation range for an extended period. This persistent buying interest has gradually weakened bearish pressure, hinting that the market could be gearing up for a significant breakout.
Key Levels to Monitor
- Resistance: $0.000110, $0.000120, $0.000130
- Support: $0.000090, $0.000085, $0.000080
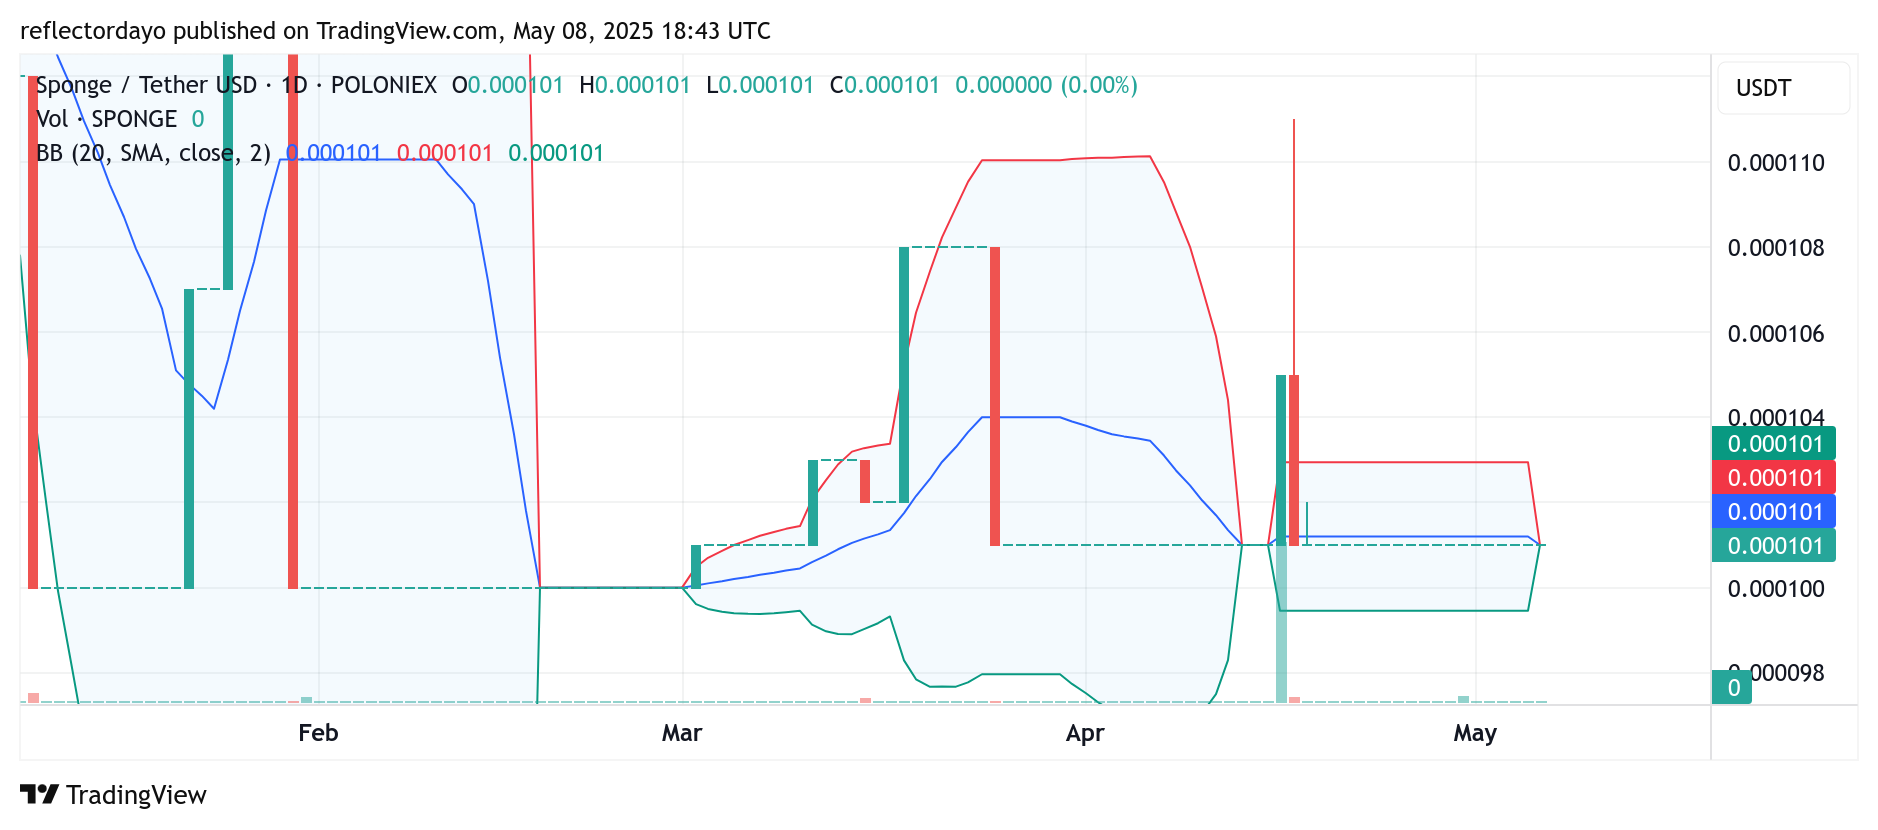
$SPONGE Daily Outlook: Narrowing Bollinger Bands Signal Possible Breakout
The $SPONGE daily chart displays an increasingly tight Bollinger Band formation around the $0.0001 region. This notable contraction—often referred to as a “volatility squeeze”—indicates that volatility has significantly decreased following a prolonged sideways phase. Typically, such squeezes suggest that market participants are coiled for a directional move as the tug-of-war between buyers and sellers begins to wane. Historically, these crypto signal setups often precede sharp price movements, providing early opportunities for traders who are looking to capitalize on an impending breakout.
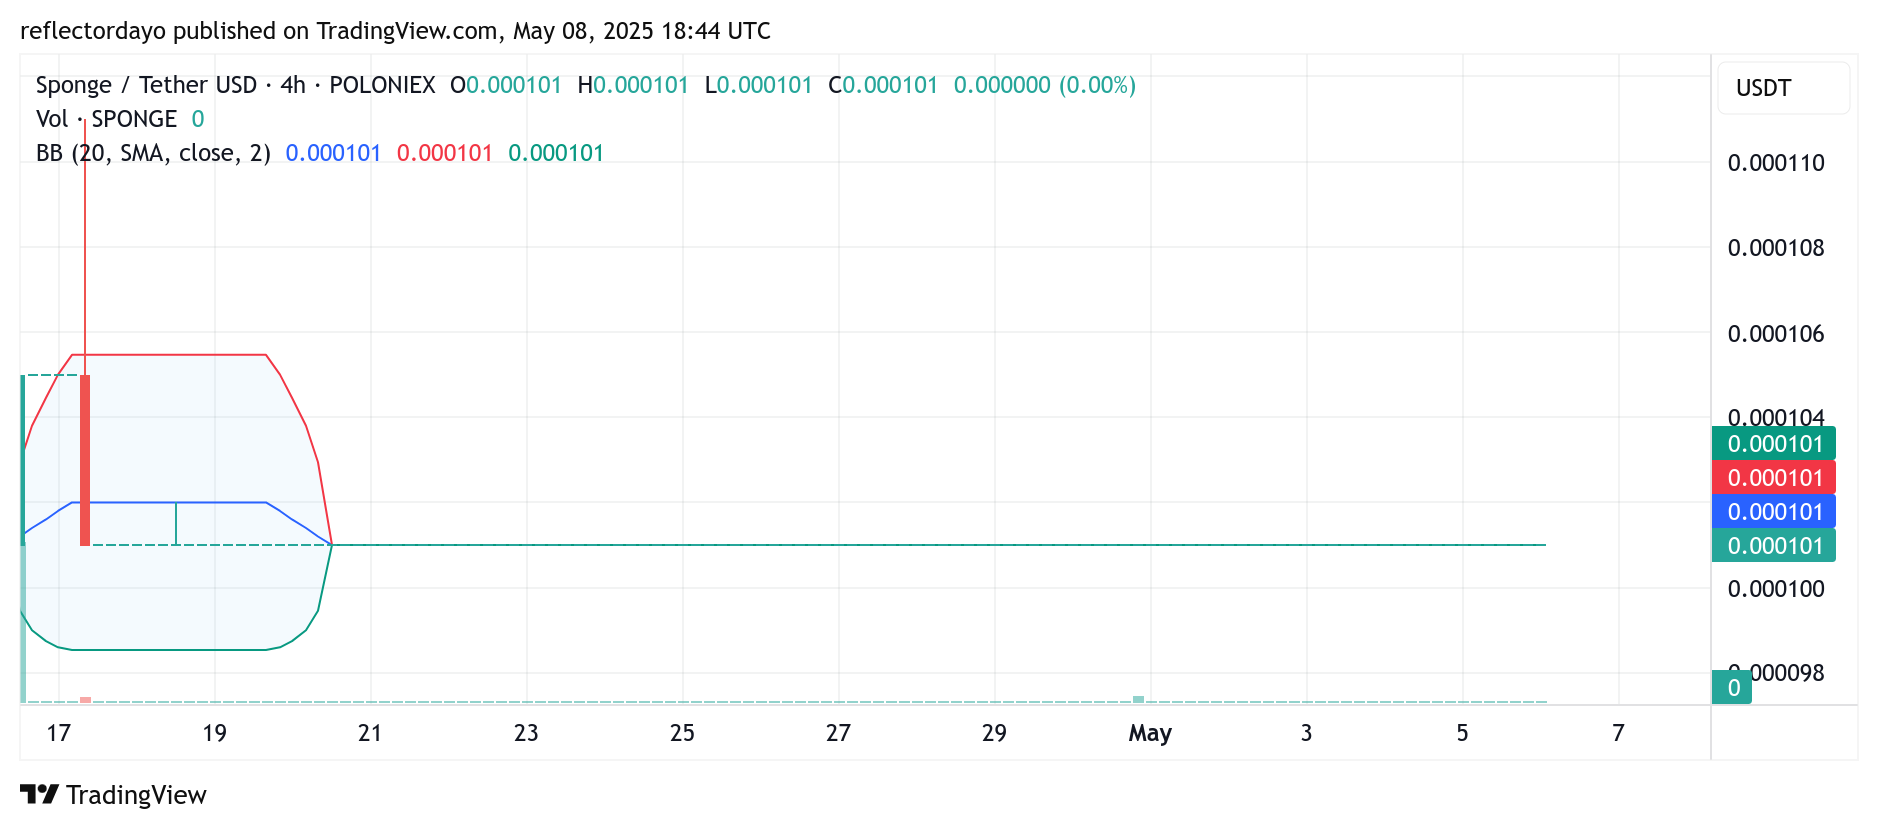
SPONGE/USD 4-Hour Perspective: Extended Volatility Compression Hints at Sharp Move Ahead
While the daily chart has only recently reflected tightening volatility, the 4-hour chart has shown a pronounced Bollinger Band squeeze over the past few sessions. The price has remained confined within a narrow range around the $0.0001 mark, depicting a prolonged phase of minimal volatility. Historically, such compressions tend to precede sudden market moves, often delivering a clear trend direction. With pressure building, traders could view this as a prime opportunity to position for a bullish breakout, potentially targeting resistance levels for favorable gains.
Buy SPONGE/USD!
Don’t be the guy who faded pic.twitter.com/tC1QJmLOkj
— $SPONGE (@spongeoneth) May 2, 2025
Join the SPONGE community and get in on the next big crypto opportunity! Buy Sponge ($SPONGE) today