SPONGE/USD ($SPONGE) Market Outlook: Is a Breakout Above $0.0001 Imminent?
Estimated Reading Time: 3 minutes
Don’t invest unless you’re prepared to lose all the money you invest. This is a high-risk investment and you are unlikely to be protected if something goes wrong. Take 2 minutes to learn more

The $SPONGE market continues to consolidate near the key $0.0001 level, maintaining a tight trading range following its recent surge toward the $0.0002 threshold. While the market failed to hold above that higher level, this retreat is not necessarily a sign of weakness. On the contrary, the sustained consolidation suggests that the market may be gathering momentum for its next decisive move—much like a compressed spring ready to release.
The current sideways price action reflects a tug-of-war between bullish and bearish forces. Notably, the bulls have been consistently defending the $0.0001 support, signaling active accumulation by market participants. This kind of prolonged stabilization is often a precursor to a strong breakout.
With price compression building beneath the surface, traders and analysts alike are keeping a close eye on this critical zone. A decisive move above $0.0001 could pave the way for a renewed bullish rally, making this a pivotal moment for the $SPONGE market.
Key Technical Levels
- Resistance: $0.000110, $0.000120, $0.000130
- Support: $0.000090, $0.000085, $0.000080

SPONGE/USD 4-Hour Chart: Bulls Regain Control Amid Ongoing Consolidation
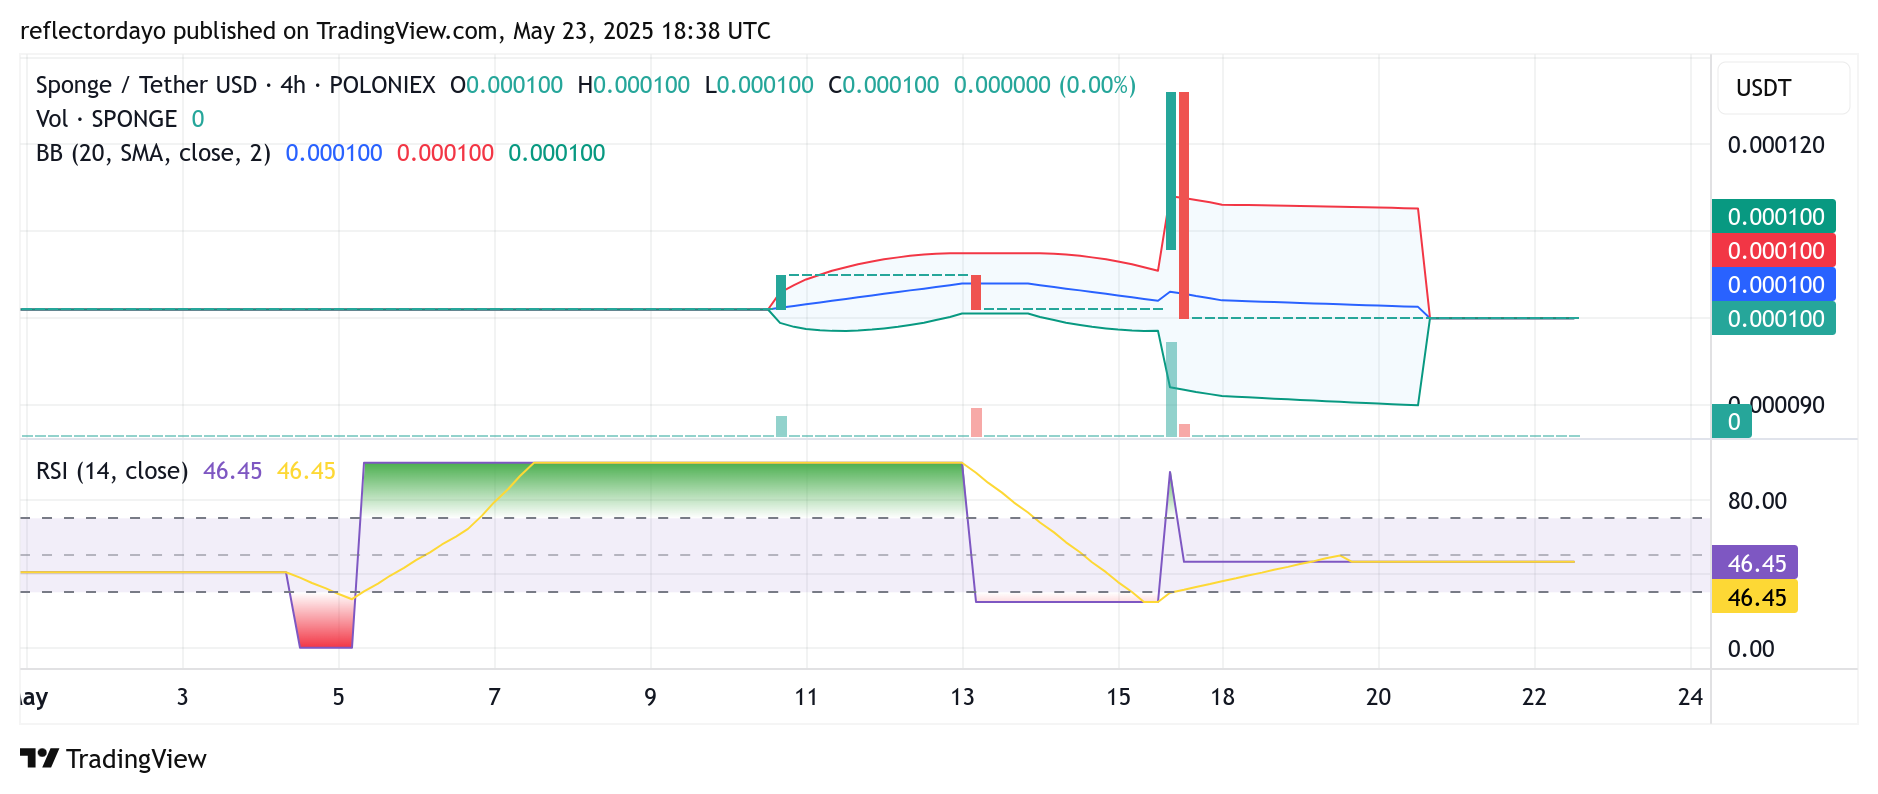
On the 4-hour chart, $SPONGE is exhibiting signs of stabilization following a notable upward move. The Bollinger Bands—along with the price and both standard deviation curves—are converging around the $0.0001 level, indicating a prolonged phase of consolidation.
Bearish momentum has notably diminished, allowing buyers to step in and defend this critical support zone. The successful defense of the $0.0001 level suggests that bearish pressure is weakening, setting the stage for a potential bullish reversal.
This subdued price activity may also point to quiet accumulation, as market participants position themselves for a possible breakout. Should the price break decisively above nearby resistance levels, it could trigger a fresh bullish leg and set the tone for new highs in the near future.
SPONGE/USD 1-Hour Chart: Volatility Squeezes as Market Eyes Potential Breakout
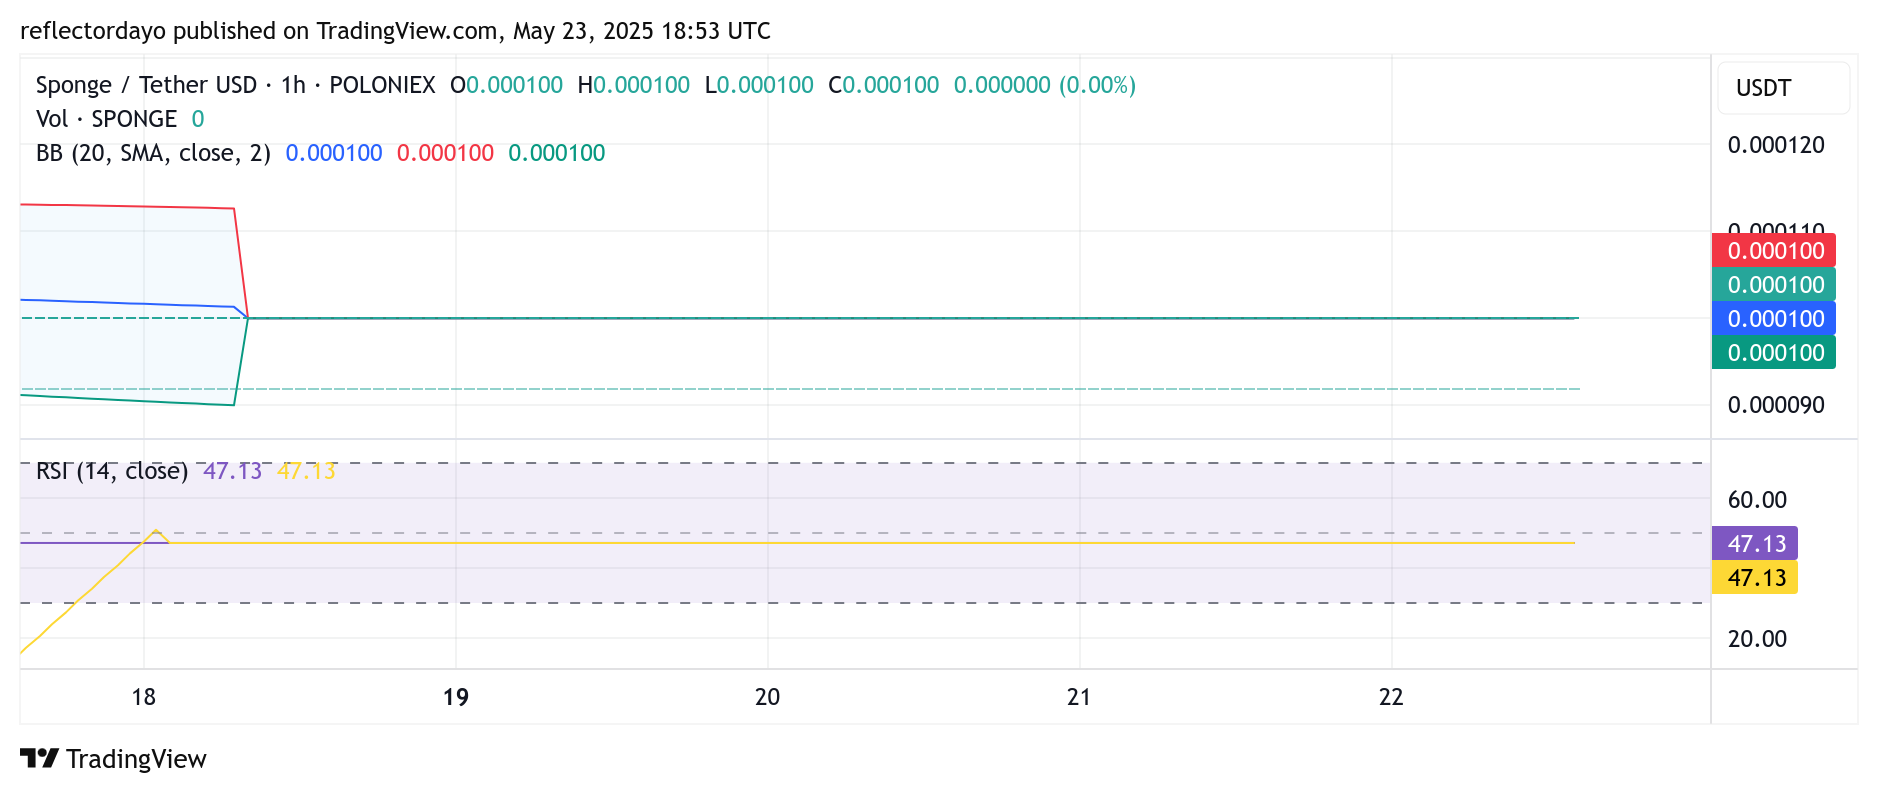
A closer look at the 1-hour chart reveals tightening consolidation, signaling that a breakout may be imminent. The Bollinger Bands are contracting, a classic indicator of reduced volatility and a market preparing for a significant directional move.
This narrowing range, combined with steady trading volume and firm support levels, suggests that SPONGE/USD is coiling for a potential surge. If bullish momentum resurfaces, the price could swiftly climb toward higher resistance levels—creating timely opportunities for proactive traders.
Buy SPONGE/USD!
To all the bears out there pic.twitter.com/T2qkNnFEBY
— $SPONGE (@spongeoneth) May 23, 2025
Join the SPONGE community and get in on the next big crypto opportunity! Buy Sponge ($SPONGE) today