Stellar (XLM/USD) Bullish Rally Faces Resistance at $0.25, with $0.20 Potentially Emerging as Key Support
Estimated Reading Time: 3 minutes
Don’t invest unless you’re prepared to lose all the money you invest. This is a high-risk investment and you are unlikely to be protected if something goes wrong. Take 2 minutes to learn more
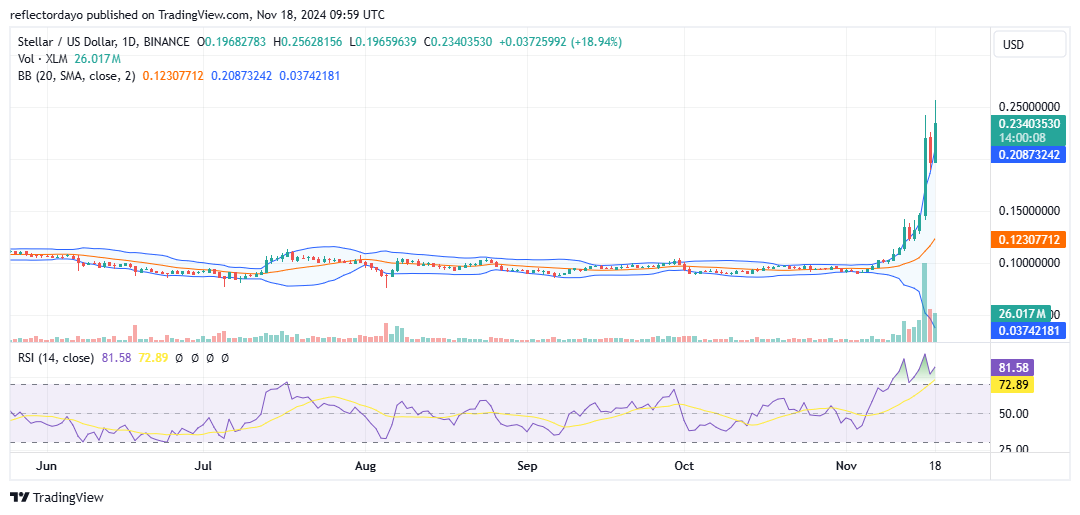
November has been a favorable month for optimistic Stellar (XLM) traders, as the market has shown a relentless upward surge. The bullish momentum gained significant strength after breaking above the $0.14 price level, marking a critical turning point. A similar pattern appears to be unfolding in the current market, with the price rebounding from the $0.20 level, driven by strong buying interest. This rebound has attracted further bullish sentiment, propelling the price upward to $0.25. However, profit-taking by some traders at this level has triggered a market correction.
Stellar Market Data
- XLM/USD Price Now: $0.24
- XLM/USD Market Cap: $7 billion
- XLM/USD Circulating Supply: 30 billion
- XLM/USD Total Supply: 50 billion
- XLM/USD CoinMarketCap Ranking: #21
Key Levels
- Resistance: $0.25, $0.30, and $0.35
- Support: $0.20, $0.15., and $0.12.
Stellar Market Through the Lens of Indicators
The current bullish trend remains aggressively strong, favoring the bulls. However, technical indicators highlight potential overbought conditions. The significant buying pressure, which currently outweighs selling activity, has sparked explosive interest in the crypto signal, leading to rapid and erratic price oscillations. Notably, these fluctuations have pushed the Relative Strength Index (RSI) into overbought territory, signaling caution for new traders considering entering bullish positions.
While $0.20 is emerging as a strong support level and may offer a safer entry point, there is still a risk as the market could retest $0.25. From the perspective of the Bollinger Bands indicator, the bands are highly divergent, indicating strong market volatility. Despite this, the overall market bias remains strongly bullish.
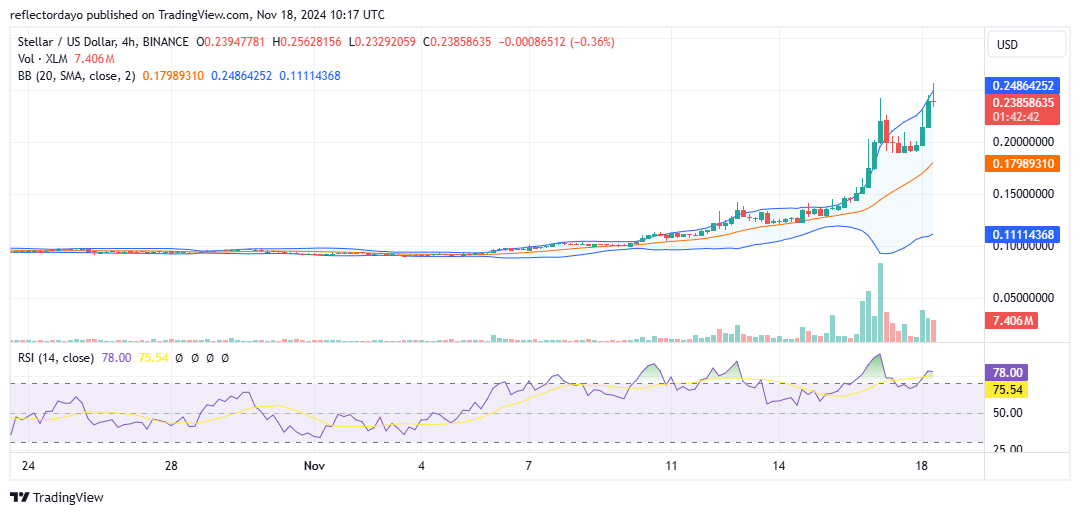
XLM/USD Price Prediction: 4-Hour Chart Analysis
The Stellar market had been in prolonged consolidation until recently, when it began an aggressive bullish movement in November. It is remarkable how the price has continued to climb to higher levels. Traders who had been holding long positions for an extended period, anticipating an upward breakout, finally saw their expectations materialize as the market surged in November. This sustained upward momentum indicates strong investor confidence, suggesting underlying fundamentals may be driving the market higher.
However, recent price action, as evidenced by the appearance of a shooting star candlestick near the $0.25 level on the 4-hour chart, signals the possibility of a market correction. Should this occur, there is hope for a bullish rebound at the $0.20 support level, which has proven to be a critical zone for buyers.