Sui Market (SUI/USD) May Be Ending Its Downtrend at $1.36
Estimated Reading Time: 3 minutes
Don’t invest unless you’re prepared to lose all the money you invest. This is a high-risk investment and you are unlikely to be protected if something goes wrong. Take 2 minutes to learn more

The Sui market may be approaching the end of the prolonged downtrend that began around the $3.50 price level. Bearish sentiment strengthened significantly after the price slipped below the $3.00 mark, allowing sellers to gradually gain traction and eventually drive the market beneath the $2.00 level.
However, by the time the price reached the lower regions, bearish momentum was already weakening. The market eventually found a bottom around the $1.36 support level, leading to a period of consolidation that helped exhaust selling pressure.
In today’s trading session, SUI/USD is showing strong and notable bullish activity. While this movement reflects renewed buyer interest, it is best viewed as an early-stage recovery rather than a confirmed trend reversal.
Sui (SUI/USD) Market Data
- SUI/USD Price Now: $1.77
- SUI/USD Market Capitalization: $6.6 billion
- SUI/USD Circulating Supply: 3.7 billion SUI
- SUI/USD Total Supply: 10 billion SUI
- SUI/USD CoinMarketCap Ranking: #18
Key Levels to Watch
- Resistance: $2.00, $2.50, $3.00
- Support: $1.30, $0.045, $0.040
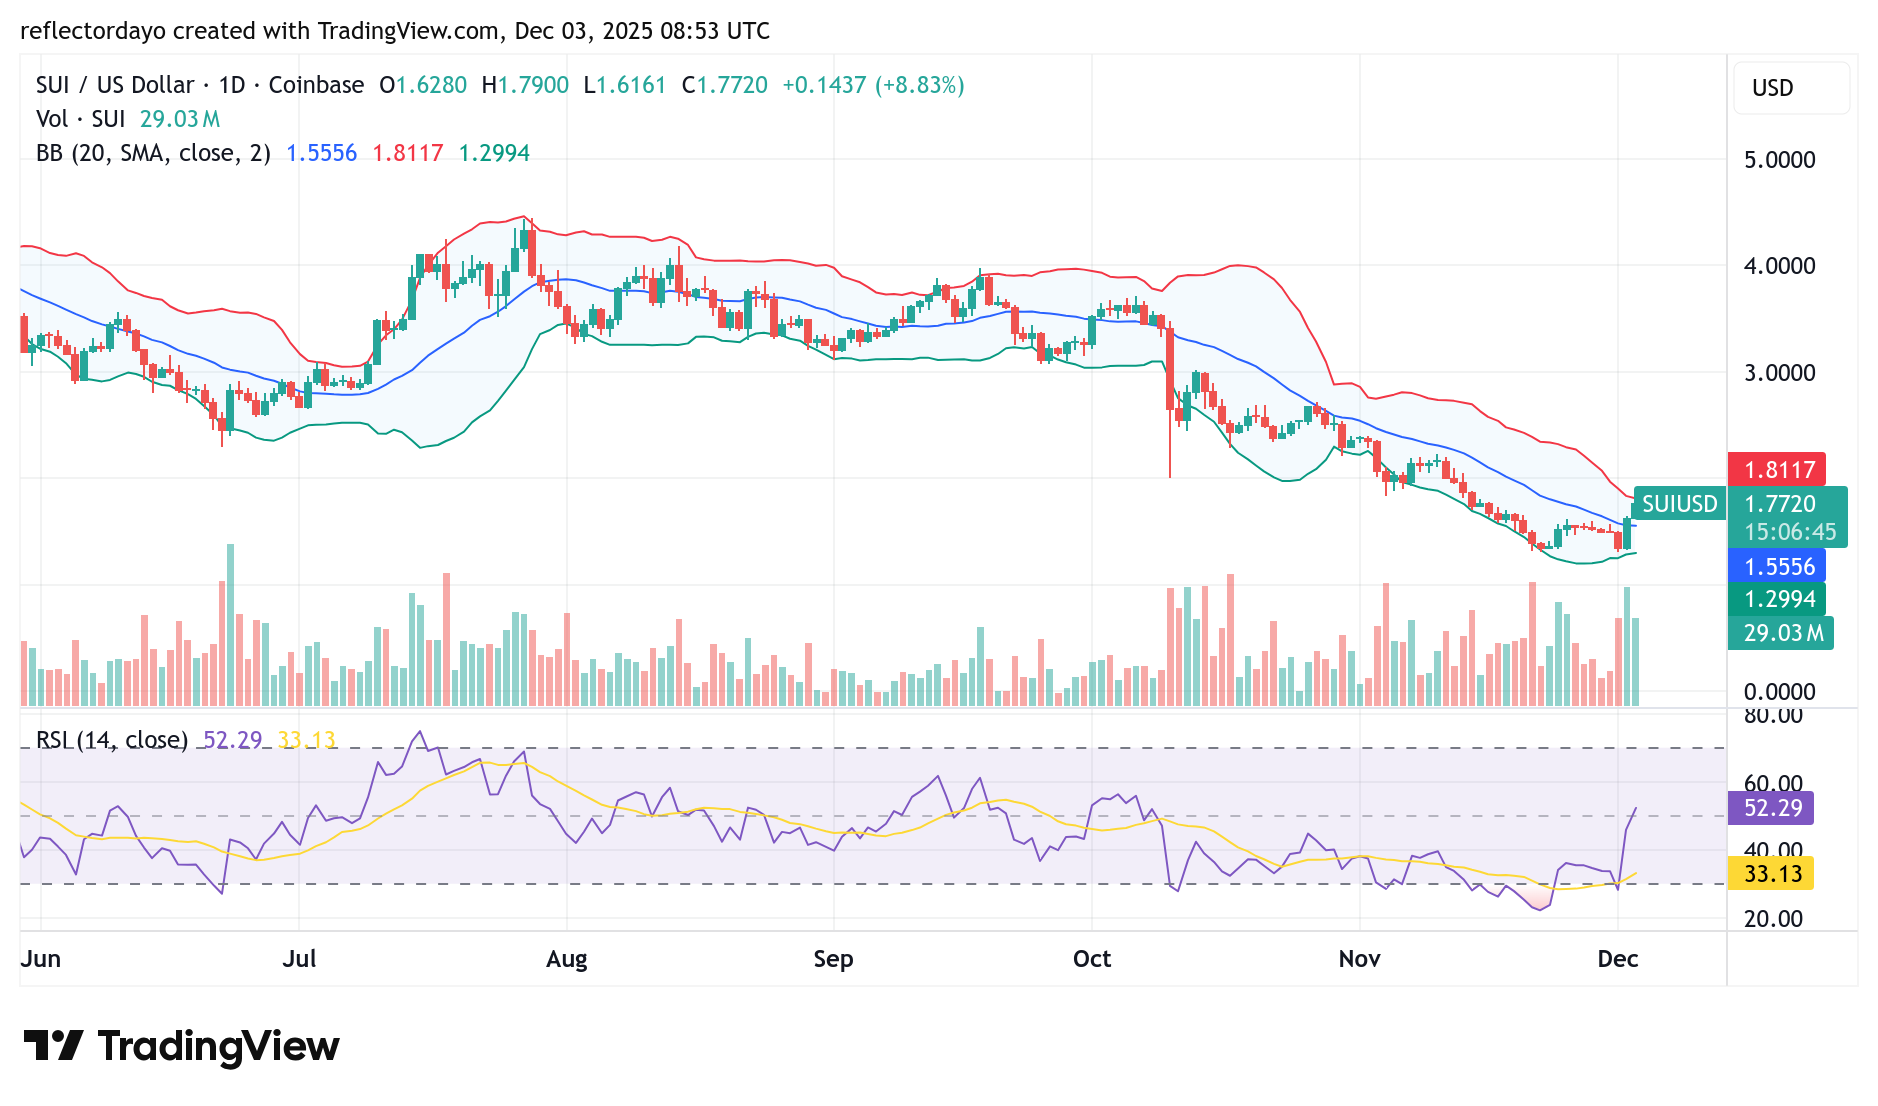
Sui (SUI/USD) Daily Chart Analysis
So far today, the Sui bulls have shown impressive strength, driving the price upward toward the critical $2.00 level. Despite this upward movement, the market is still positioned within bearish territory, meaning sellers may still retain some advantage. However, the period of consolidation that followed the drop to the $1.36 region is also a clear sign that bearish momentum has weakened significantly.
Today’s bullish recovery—currently up by about 8%—highlights renewed buying interest. However, a decisive break above the $2.00 resistance remains essential. A confirmed move beyond this level would likely attract additional bullish participation, potentially fueling further upside momentum in the crypto signal.
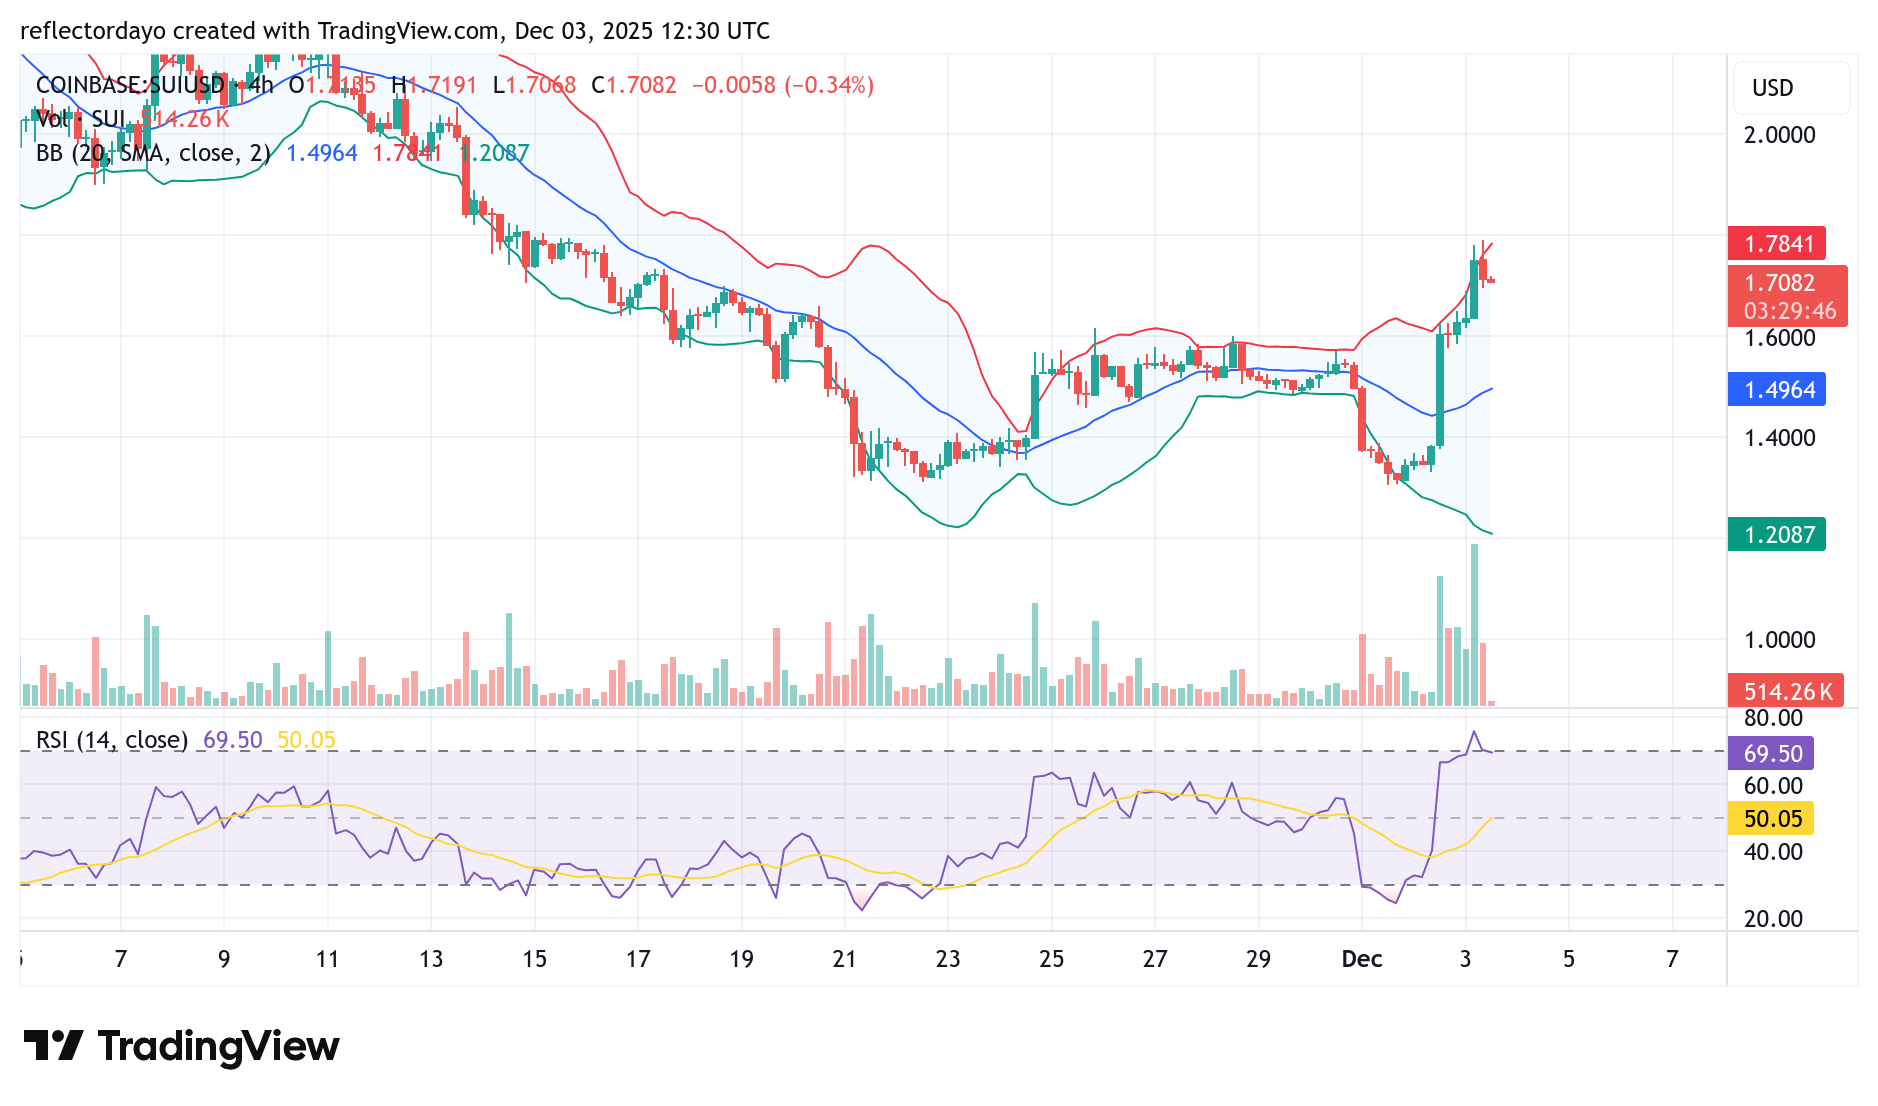
SUI/USD 4-Hour Chart Outlook
As the market pushes toward the $2.00 price level, trading volume has increased noticeably. However, this surge in volume has not translated into a stronger upward move. From the chart, traders may be considering two key factors. First, the market is approaching a major resistance zone, which may be attracting renewed bearish interest. Second, the RSI indicator shows that the market is currently in overbought territory, signaling the potential for a pullback or short-term correction.
Additionally, the wide spread of the Bollinger Bands indicates elevated volatility in the market. For a sustainable breakout above the $2.00 level, traders may look for the price to establish a stable higher support zone above the $1.50 area. Holding this support would strengthen bullish confidence and improve the likelihood of a successful breakout.