Synthetix (SNX/USD) Still Has the $3.000 Price Level Within Reach
Don’t invest unless you’re prepared to lose all the money you invest. This is a high-risk investment and you are unlikely to be protected if something goes wrong. Take 2 minutes to learn more
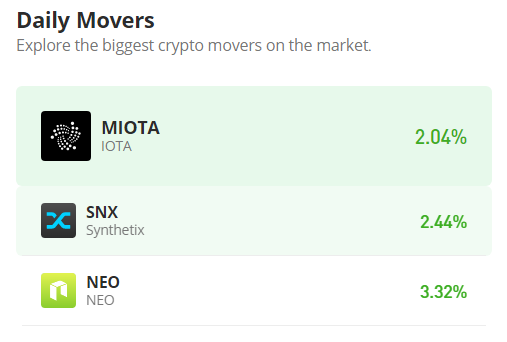
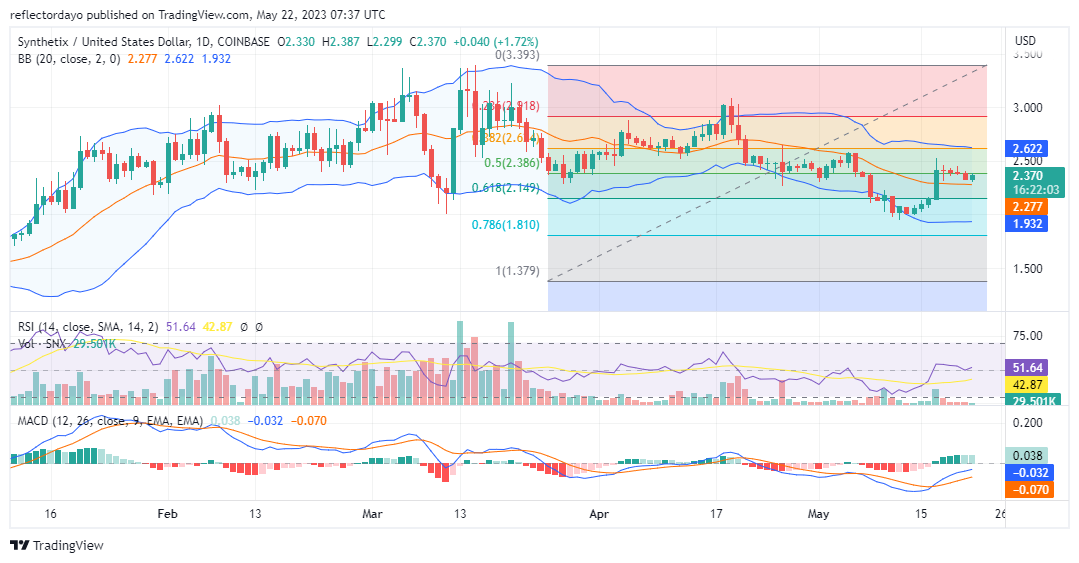
In March, the Synthetix market became very volatile. Bulls were aggressive, and the target was the $3.500 price level. But the bullish target failed to materialize because bearish resistance at $3.39 was very strong, cutting short bullish prices within each daily trading session as it tried to break the resistance. Because the sellers were stronger than the bulls at this level, they formed a lower supply level around the $3.03 price level that may have formed the basis for bear market’s further push-through into bullish zones.
SNX/USD Price Statistics
- SNXUSD Price Now: $2.44
- SNX/USD Market Cap: $632,204,866
- SNX/USD Circulating Supply: 259,293,770 SNX
- SNX/USD Total Supply: 318,625,021
- SNX/USD CoinMarketCap Ranking: #66
Key Levels
- Resistance: $2.50, $3.00, and $3.50
- Support: $2.00, $1.50, and $1.000
Price Prediction for Synthetix: The Indicators’ Point of View:
The brief bull market in March may have triggered a bear market, as since the market peaked at the $3.39 price level, it has been making lower highs. On May 5, another lower high formed at the $2.59 price level. This new lower resistance has forced the demand line to $2.149, which is the 61.8% Fibonacci level. However, this was not for long, as bulls, being slightly lower than their last line of defense, are bouncing back. According to the indicators, bullish momentum is beginning to gain traction. The Relative Strength Index (RSI) measures at level 53. The RSI line is facing the upside.
SNX/USD 4-Hour Chart Outlook:
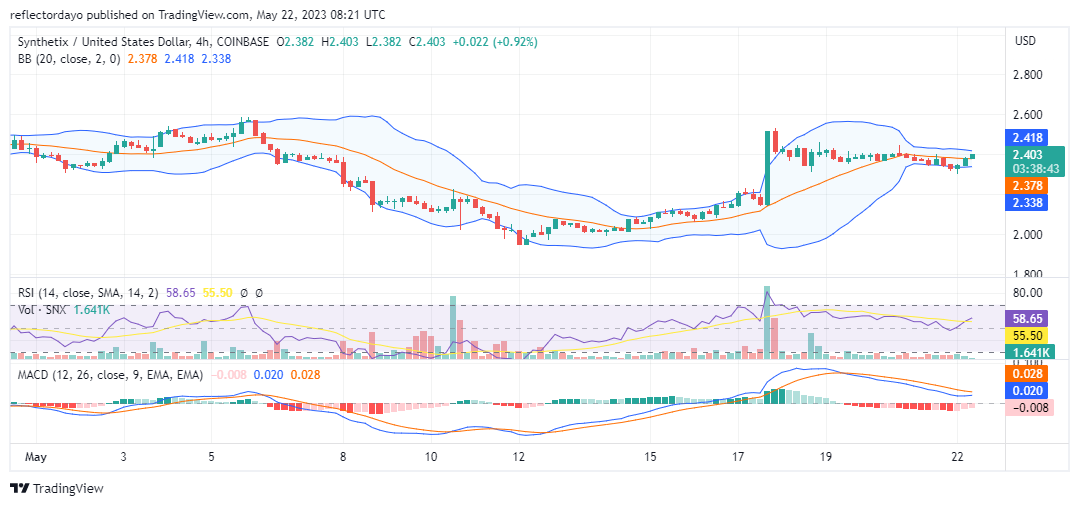
From a 1-hour point of view, the market consolidates at $2.39. On May 17, in the 16th hour of the day, the particular 1-hour session was completely bullish. A Marubozu candlestick represented the session. This one-sided bullish market triggered volatility for the following 1-hour sessions of the market since then, but this later cooled off into a consolidation trend over the weekend. The Bollinger Bands indicator converges to portray the market stabilizing around $2.39. The converging bands are expected to precede a bullish price breakout.
