Avalanche Price Prediction: AVAX/USD Keeps Moving Sideways
Estimated Reading Time: 3 minutes
Don’t invest unless you’re prepared to lose all the money you invest. This is a high-risk investment and you are unlikely to be protected if something goes wrong. Take 2 minutes to learn more
Avalanche Price Prediction – July 28
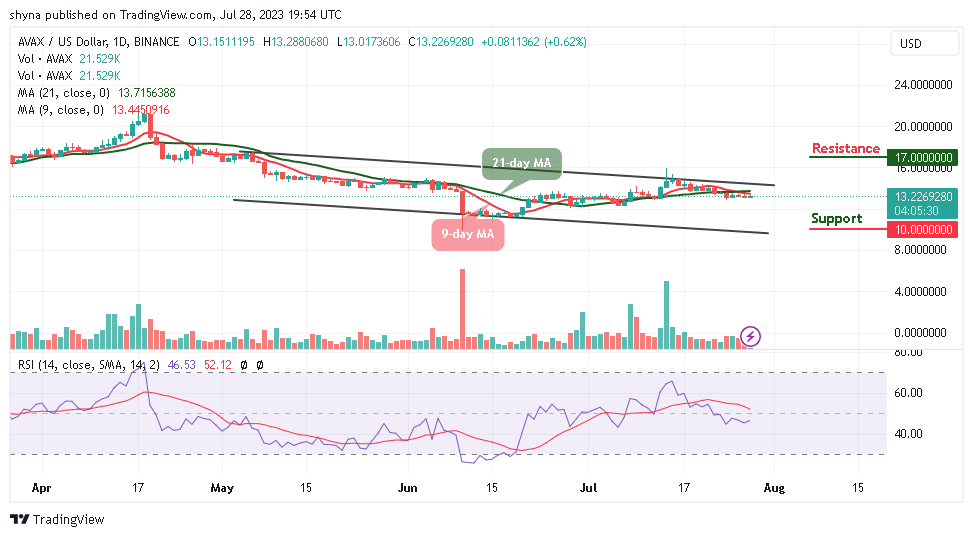
The Avalanche price prediction continues to move sideways as the price of the coin remains below the 9-day and 21-day moving averages.
AVAX/USD Long-term Trend: Ranging (1D Chart)
Key Levels:
Resistance levels: $17.00, $18.00, $19.00
Support levels: $10.00, $9.00, $8.00
AVAX/USD has been attempting to cross above the 9-day and 21-day moving averages. The daily low of $13.00 support level is the nearest support where the price could touch today. The Avalanche market has earlier consolidated at this level before making an upward movement and this makes the support level a strong support zone.
Avalanche Price Prediction: Avalanche (AVAX) May Breakout
The Avalanche price is likely to break out if the bulls push the price above the 9-day and 21-day moving averages. Meanwhile, the Avalanche price may continue its upward movement by breaking above the upper boundary of the channel to keep the upside movement strong. Therefore, any further bullish movement could take the coin to the potential resistance levels of $17.00, $18.00, and $19.00.
However, as the daily chart reveals, the bullish movement may be invalidated if the bears break toward the lower boundary of the channel, and the Avalanche price may fall below the negative side to hit the support levels of $10.00, $9.00, and $8.00. Meanwhile, the technical indicator Relative Strength Index (14) signal line is moving below the 50-level; suggesting a sideways movement.
AVAX/USD Medium-Term Trend: Ranging (4H Chart)
On the 4-hour chart, AVAX/USD is moving to cross above the upper boundary of the channel. At the moment, the Avalanche market is following the bullish movement as the price touches the daily high at $13.25.
You can purchase Avalanche here. Buy AVAX
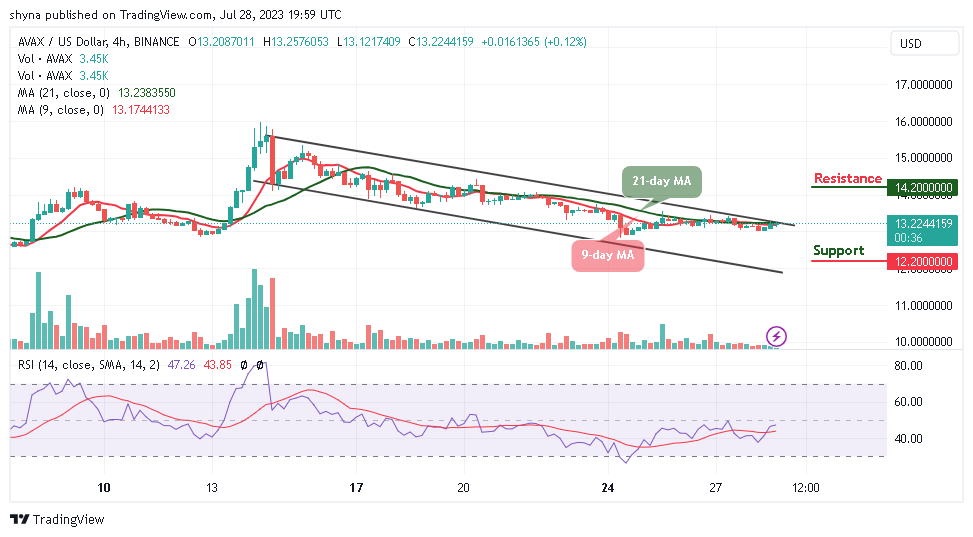
However, if the buyers push the price above the channel, higher resistance could be located at $14.20 and above. Moreover, should the bulls fail to move it above this barrier, then, the nearest support level may be located at $12.20 and below. In addition, the signal line of the Relative Strength Index (14) is likely to cross above the 50-level, which shows that buyers are coming to play out.