Tamadoge (TAMA/USD) Breaks Below $0.001
Estimated Reading Time: 3 minutes
Don’t invest unless you’re prepared to lose all the money you invest. This is a high-risk investment and you are unlikely to be protected if something goes wrong. Take 2 minutes to learn more
Contrary to expectations of a price rebound as Tamadoge approached the $0.001 mark, the token instead experienced a sharp decline. This breakdown below the critical price level ignited further selling pressure, pushing the price below $0.0009 as more traders adopted a pessimistic outlook. However, a glimmer of bullish sentiment emerged around the $0.0008 level, suggesting that some investors may be finding value at these lower prices.
Key Levels
- Resistance: $0.013, $0.014, and $0.015
- Support: $0.0008, $0.00078 and $0.00074
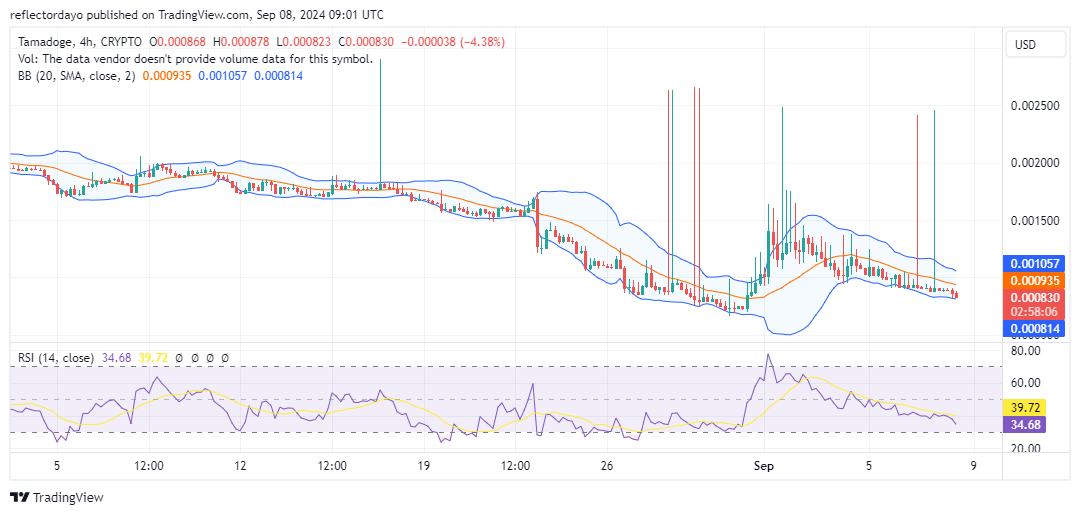
TAMA/USD Price Analysis: The Indicators’ Point of View
Technical indicators are currently flashing bearish signals for the cryptocurrency market. However, amidst this bearish backdrop, there are signs of resilience from buyers, as evidenced by repeated attempts to rally the price. One notable characteristic of these bullish efforts is the frequent appearance of upper shadows on the candlestick chart, indicating that buyers are actively stepping in, but are struggling to overcome the prevailing bearish sentiment.
The Bollinger Bands are currently displaying a downward sloping trend channel, further reinforcing the bearish outlook. Additionally, the Relative Strength Index (RSI) is trending downwards and is approaching the oversold region at the 30 level. This suggests that the market may be becoming oversold, potentially setting the stage for a potential rebound.
Encouragingly, there are recent signs of a potential support level emerging around the $0.0008 price mark, as indicated by the formation of two consecutive candlesticks near this level. If this support holds, it could provide a temporary respite from the selling pressure and potentially spark a short-term recovery. However, it is crucial to remain vigilant and monitor the broader market conditions for any further developments.
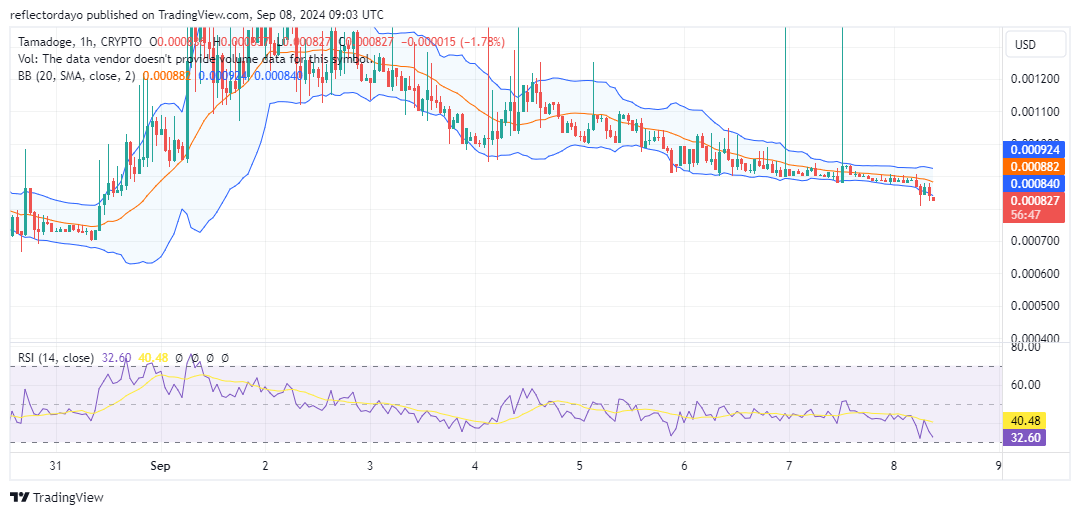
Tamadoge Short-Term Outlook: 1-Hour Chart
From a short-term perspective, there is increasing evidence suggesting that a support level may be forming around the $0.00082 price point. This development raises the possibility of a potential price rebound in the near future.
The Bollinger Bands indicator is currently signaling an oversold condition, as the price action has recently penetrated below the lower standard deviation band. This oversold crypto signal might present an opportunity for traders to buy the dip and attempt to reverse the downward trend.