Tamadoge (TAMA/USD) Bulls Defiant at $0.0018, Uptrend Imminent
Estimated Reading Time: 2 minutes
Don’t invest unless you’re prepared to lose all the money you invest. This is a high-risk investment and you are unlikely to be protected if something goes wrong. Take 2 minutes to learn more
The resilient bullish trend observed in the TAMA/USD market eventually gave way to bearish momentum, causing the price to decline towards the $0.0018 level. However, there are signs that the bearish momentum is waning, as a four-price doji has appeared in the current trading session. The emergence of this candlestick pattern signals that the market may be primed for a rally.
Key Levels
- Resistance: $0.013, $0.014, and $0.015
- Support: $0.0018, $0.00175 and $0.0016
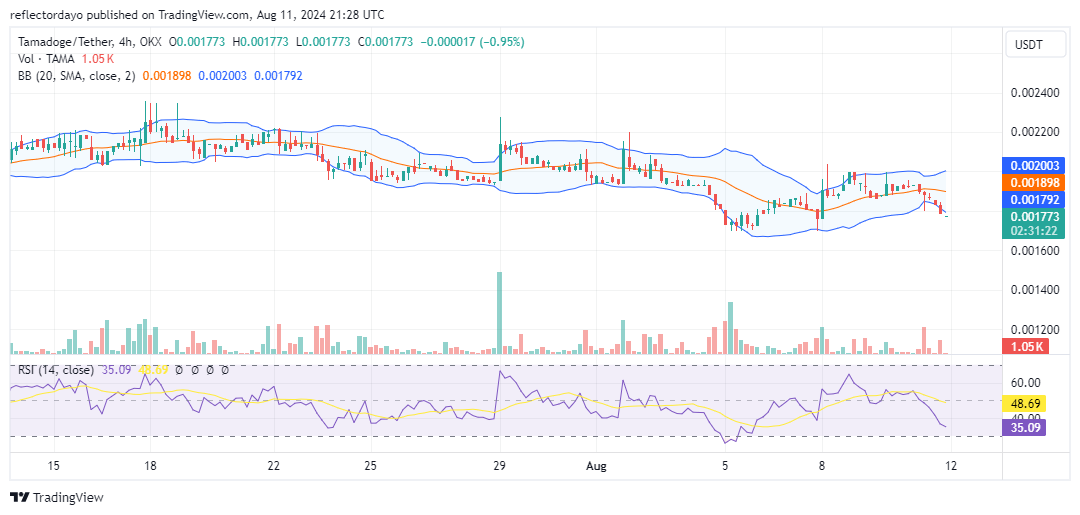
TAMA/USD Price Analysis: The Indicators’ Point of View
A support level has emerged at $0.0018, but residual bearish pressure caused the price action to dip beyond the lower Bollinger Band. This movement suggests that the market is being sold below its intrinsic value, indicating that a correction is likely. Additionally, there is a major support level at $0.001764, further suggesting the potential for a rally from this crypto signal. The low trading volume and the appearance of a four-price doji in the current session undermine the credibility of the ongoing bearish trend, implying that investors are likely to begin buying at this level.
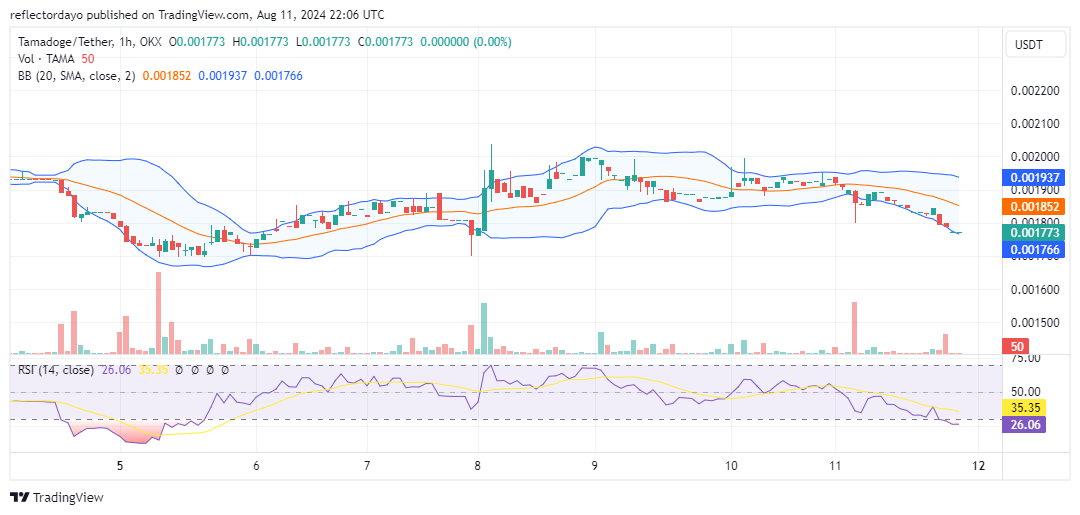
Tamadoge Short-Term Outlook: 1-Hour Chart
ince the start of today’s trading in the TAMA/USD market, the bearish trend has been prevalent. Price action has consistently hovered near the lower Bollinger Band. As a result, the lower band has diverged downward but now appears to have found support at $0.001775. The appearance of two consecutive dojis suggests that the market may be poised for an upward move, signaling the potential end of the bearish momentum.
Buy Tamadoge!
If you’re a cat lover, you’re not welcome here! ⚠️
Just joking (not really) 😝 pic.twitter.com/Af6hhKYvYr
— TAMADOGE (@Tamadogecoin) August 9, 2024