Tamadoge (TAMA/USD) Bulls Sustain Upward Pressure Toward Key Resistance at $0.00055
Estimated Reading Time: 3 minutes
Don’t invest unless you’re prepared to lose all the money you invest. This is a high-risk investment and you are unlikely to be protected if something goes wrong. Take 2 minutes to learn more
Amid heightened volatility and renewed interest in the Tamadoge (TAMA/USD) market, bullish momentum has remained resilient. Over a notable period, buyers have consistently maintained higher lows—an indication of growing market strength—as they continue to target the key resistance at the $0.00055 level.
From a technical perspective, indicators reflect a steady yet subtle bullish advance, suggesting that the market is building momentum for a potential breakout above this critical threshold.
Key Levels to Watch:
Resistance: $0.00055, $0.00060, $0.00065
Support: $0.00042, $0.00040, $0.00035
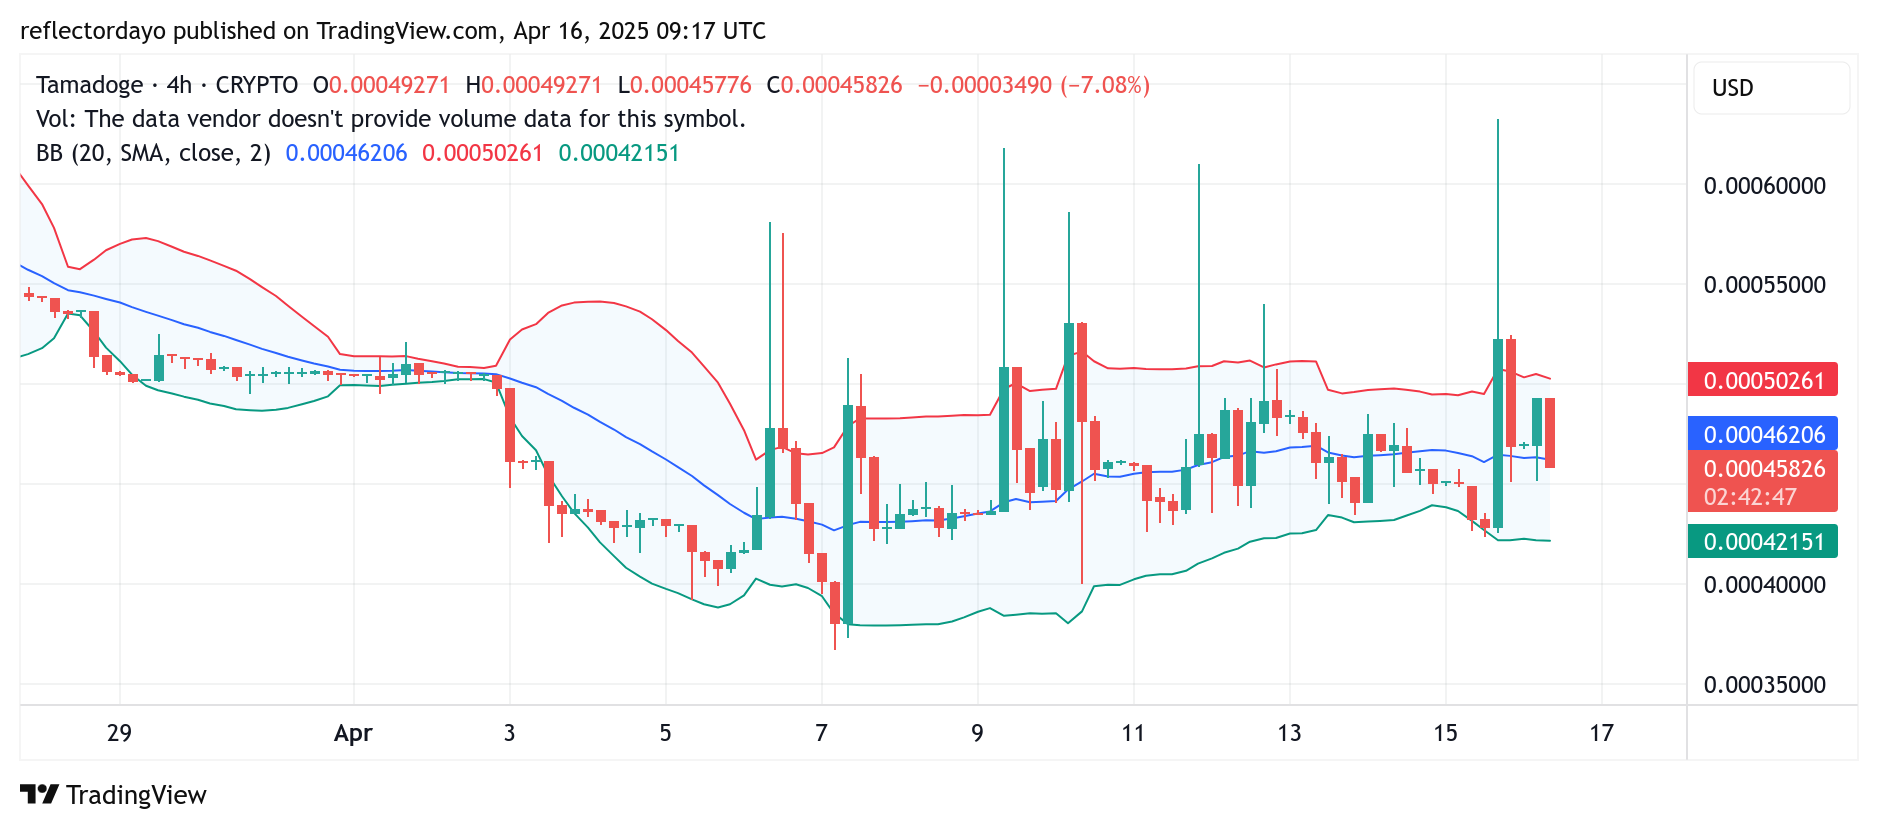
Tamadoge Forms Bullish Foundation Around $0.00046 as Price Approaches Key Resistance
Despite the ongoing volatility and a persistent tug-of-war between buyers and sellers, the 4-hour chart reveals that bulls are beginning to assert control in the Tamadoge (TAMA/USD) market. Since establishing a pivotal support level on April 7, buyers have successfully pushed the higher support to $0.00046.
Notably, the crypto signal has repeatedly tested the $0.0006 resistance level, with bullish pressure steadily advancing into this zone. However, with many traders likely anticipating a bearish reaction at this resistance, volatility has spiked—making it increasingly difficult for bulls to defend their newly formed support at $0.00046.

Short-Term Technical Outlook on TAMA/USD: 1-Hour Chart Suggests Imminent Price Swing
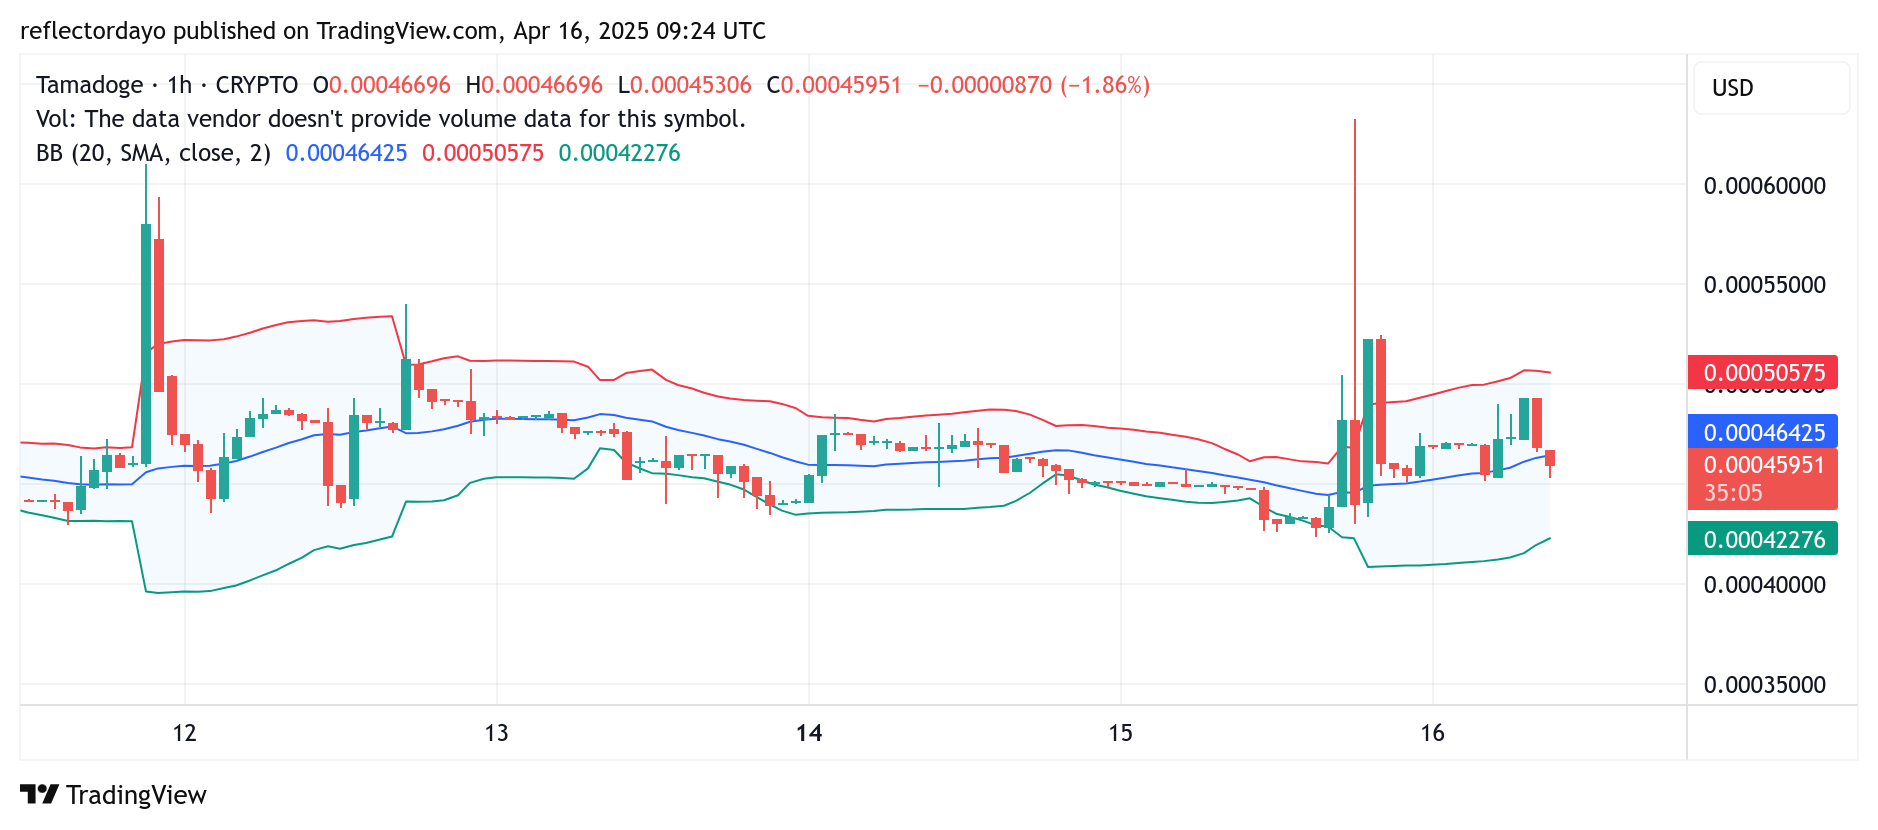
Zooming into the 1-hour chart, the Bollinger Bands display a substantial bandwidth, indicating heightened volatility and the potential for a significant price swing.
From the broader 4-hour chart, we previously observed the market attempting to hold its ground around the $0.00046 support level. However, on the lower timeframe, the price has now broken below this level, trending toward $0.00045.
Should the market reach this key support zone, a potential bounce could follow—offering bulls an opportunity to regain momentum.
Buy Tamadoge!
There’s no mobile runner out there quite like #TamadogePursuit! 🏃♂️
1️⃣ Sign up – start with 20 free credits for a boost!
2️⃣ Climb up the leaderboards.
3️⃣ Win $TAMA rewards!Play Now! 👇
📱Android: https://t.co/Of8SYALRzL
📱 iOS: https://t.co/IthvqovwAH pic.twitter.com/84HNqob9Rf— TAMADOGE (@Tamadogecoin) September 10, 2024