Tamadoge (TAMA/USD) Eyes Bullish Rebound from Key $0.00045 Support Level
Estimated Reading Time: 3 minutes
Don’t invest unless you’re prepared to lose all the money you invest. This is a high-risk investment and you are unlikely to be protected if something goes wrong. Take 2 minutes to learn more

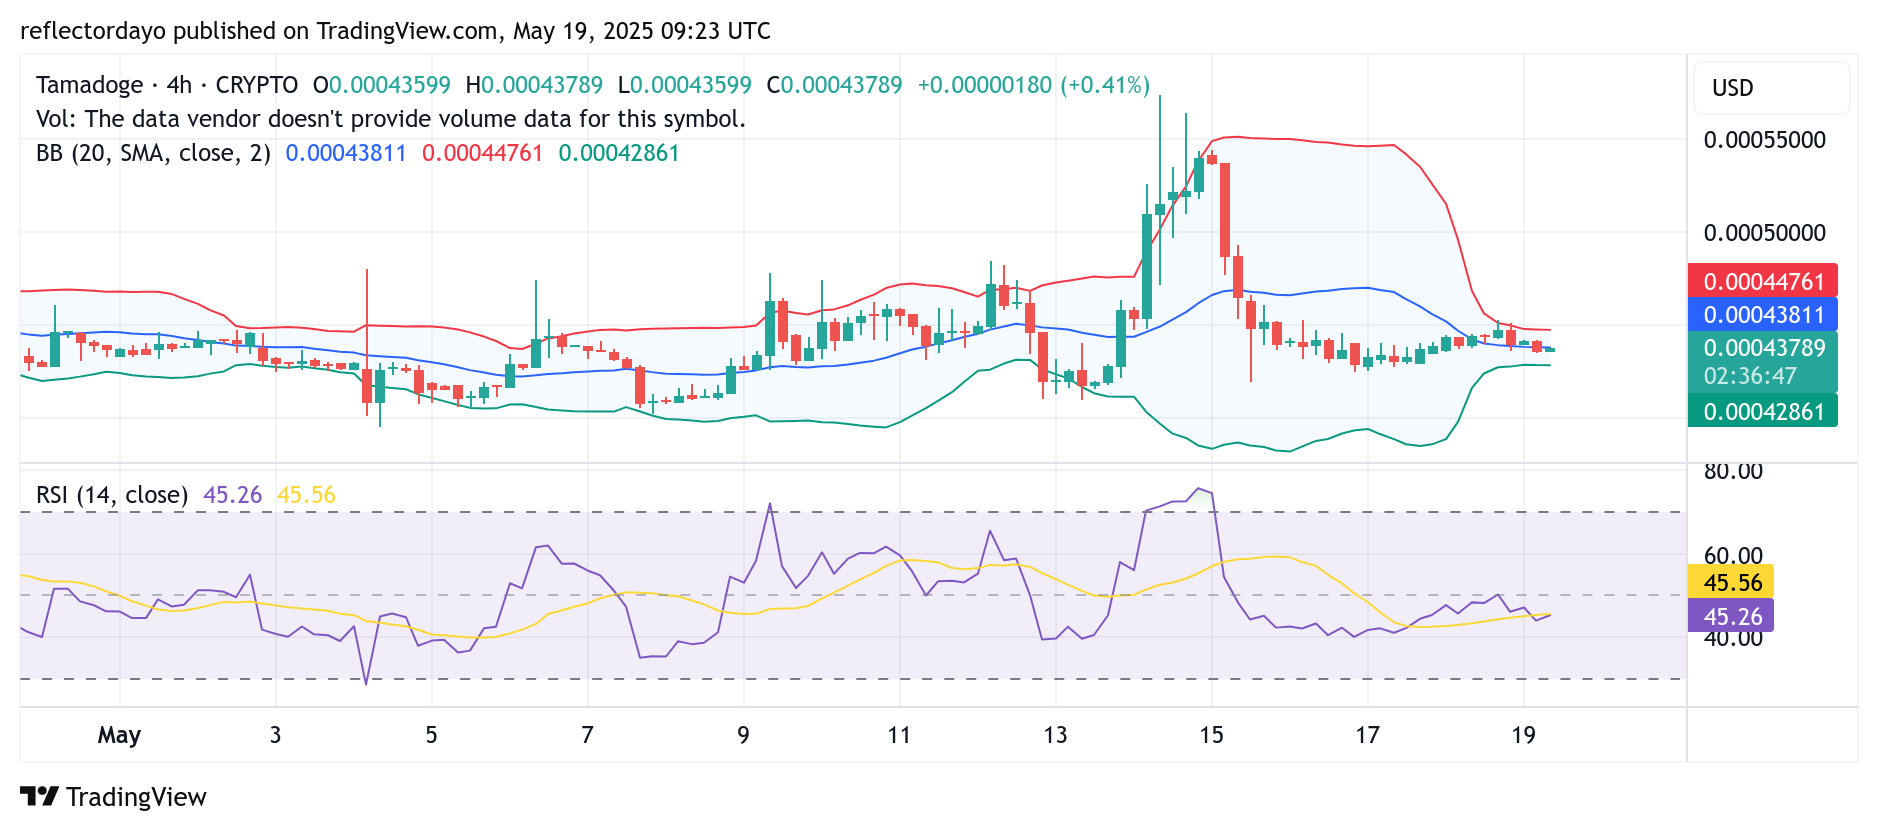
Tamadoge (TAMA/USD) is currently attempting a bullish rebound as the $0.00045 level continues to serve as a critical support zone. After a recent upward push that saw the price reach a high of $0.00055—triggering a spike in market volatility—the asset faced resistance and retraced to retest the $0.00045 area. Since then, price action has been consolidating around this support, suggesting the potential for a rebound if bullish momentum builds from this level.
Key Levels of Interest
- Resistance: $0.00045, $0.00050, $0.00055
- Support: $0.00041, $0.00040, $0.00035
Technical Outlook: Bulls Defend Key Support as Tamadoge Prepares for Potential Breakout
Based on historical price behavior, the $0.00045 level has consistently acted as a strong support zone in the Tamadoge (TAMA/USD) market. The current retest of this level may signal the start of a bullish rebound, as buyers continue to show resilience and defend this price point.
The ongoing sideways consolidation suggests that bulls are firmly holding their ground, preventing bears from pushing the price below this critical threshold. If this defense persists, it could eventually exhaust bearish pressure, setting the stage for a breakout to the upside and the possibility of new short-term highs.
Supporting this outlook, the Bollinger Bands are converging into a tight price channel—a classic indicator of an imminent volatility spike. Traders should take note of this compression and be prepared to capitalize on the next decisive move in the market.
1-Hour Chart Analysis: RSI Signals Waning Bearish Pressure and Potential Bullish Shift
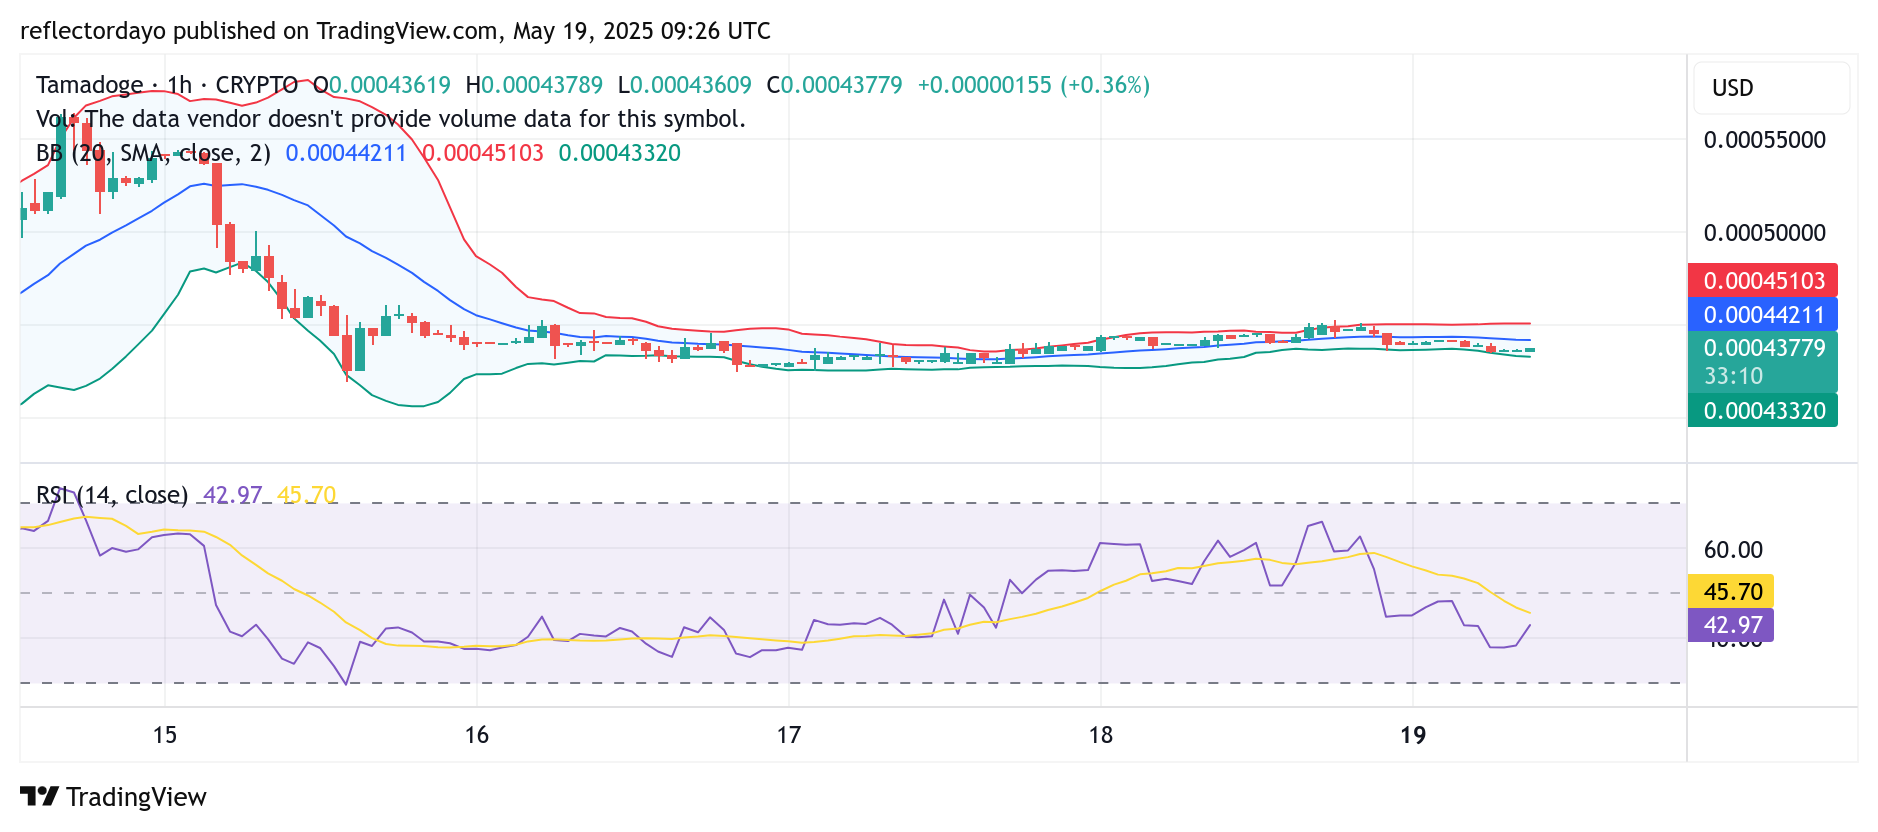
A closer look at the Tamadoge (TAMA/USD) 1-hour chart reveals a notable pattern in the Relative Strength Index (RSI). The RSI had been hovering around the 39 level, reflecting prolonged sideways movement and lingering bearish sentiment. However, in the most recent hourly session, the RSI has begun to edge upward—an early indication that bearish momentum may be weakening.
This subtle shift suggests that bulls could be preparing to take control, potentially driving the market toward higher price levels. Traders are advised to monitor this development closely and consider positioning themselves to take advantage of a possible bullish breakout.
Buy TAMA/USD!
There’s no mobile runner out there quite like #TamadogePursuit! 🏃♂️
1️⃣ Sign up – start with 20 free credits for a boost!
2️⃣ Climb up the leaderboards.
3️⃣ Win $TAMA rewards!Play Now! 👇
📱Android: https://t.co/Of8SYALRzL
📱 iOS: https://t.co/IthvqovwAH pic.twitter.com/84HNqob9Rf— TAMADOGE (@Tamadogecoin) September 10, 2024