Tamadoge (TAMA/USD) Finds Footing at Key Support Level
Estimated Reading Time: 2 minutes
Don’t invest unless you’re prepared to lose all the money you invest. This is a high-risk investment and you are unlikely to be protected if something goes wrong. Take 2 minutes to learn more

After a significant drop that pushed Tamadoge (TAMA/USD) below the $0.00005 mark, the market has shown signs of stabilization. The price has found a solid base around the $0.000022 level, where strong buying interest has successfully fended off further bearish pressure. This resilience suggests a potential shift in momentum, with bulls actively defending this critical support zone.
Key Price Points
- Resistance: $0.00045, $0.00050, $0.00055
- Support: $0.000022, $0.000021, $0.000020
TAMA/USD Technical Outlook: Chart Signals Point to Potential Reversal
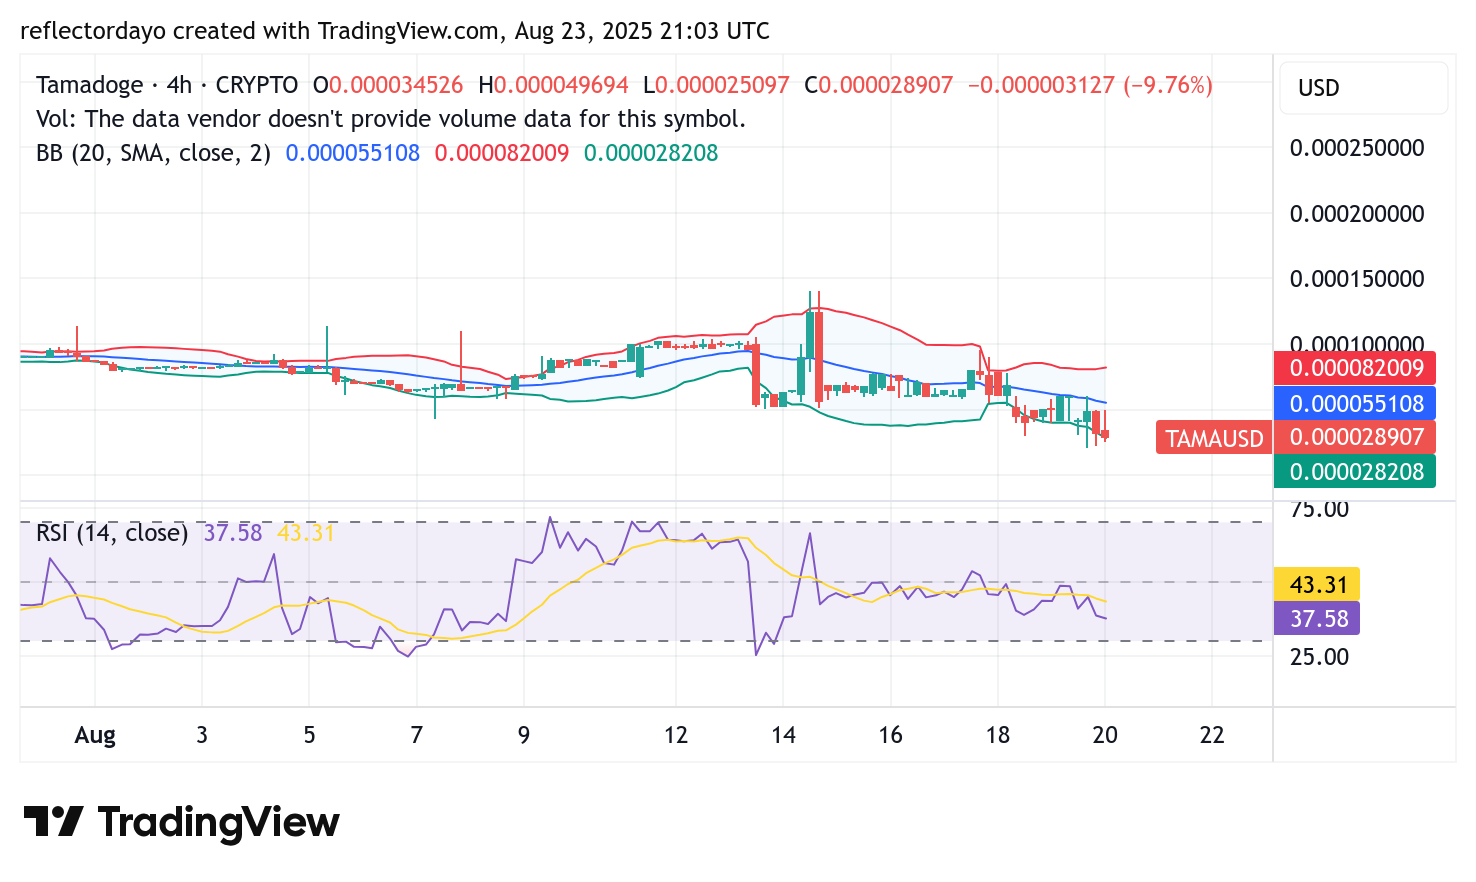
On the 4-hour chart, the downtrend that saw TAMA/USD break below $0.00005 has encountered significant pushback at the $0.000022 area. The repeated rejection of selling attempts at this level confirms its strength as a major support area. This sustained defense increases the probability of a bullish reversal and a potential bounce to the upside.
Tamadoge (TAMA/USD) 4-hour Chart Outlook
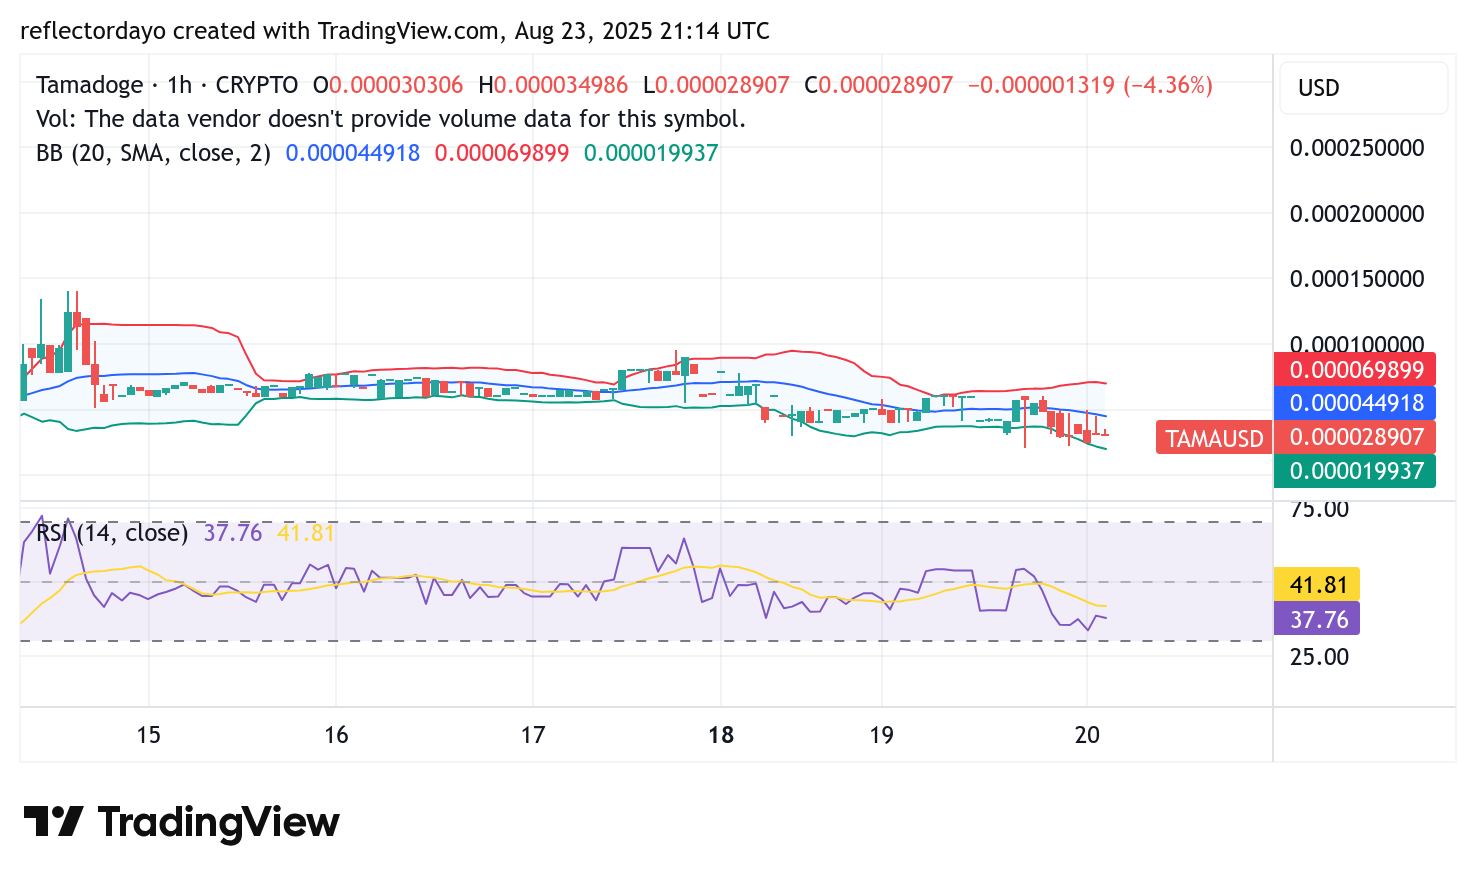
A closer look at the 1-hour chart reveals a market characterized by high volatility, as evidenced by the wide Bollinger Bands. The RSI is currently in bearish territory, but this is a common occurrence in a market testing its lows. More importantly, the appearance of specific candlestick patterns like gravestone dojis and shooting stars at the current price floor suggests that the bears may be running out of steam. This potential exhaustion among sellers could be a precursor to an impending rebound.
Buy TAMA/USD!
There’s no mobile runner out there quite like #TamadogePursuit! 🏃♂️
1️⃣ Sign up – start with 20 free credits for a boost!
2️⃣ Climb up the leaderboards.
3️⃣ Win $TAMA rewards!Play Now! 👇
📱Android: https://t.co/Of8SYALRzL
📱 iOS: https://t.co/IthvqovwAH pic.twitter.com/84HNqob9Rf— TAMADOGE (@Tamadogecoin) September 10, 2024