Tamadoge (TAMA/USD): Price Dips Test Support, But Breakout Potential Looms
Estimated Reading Time: 3 minutes
Don’t invest unless you’re prepared to lose all the money you invest. This is a high-risk investment and you are unlikely to be protected if something goes wrong. Take 2 minutes to learn more
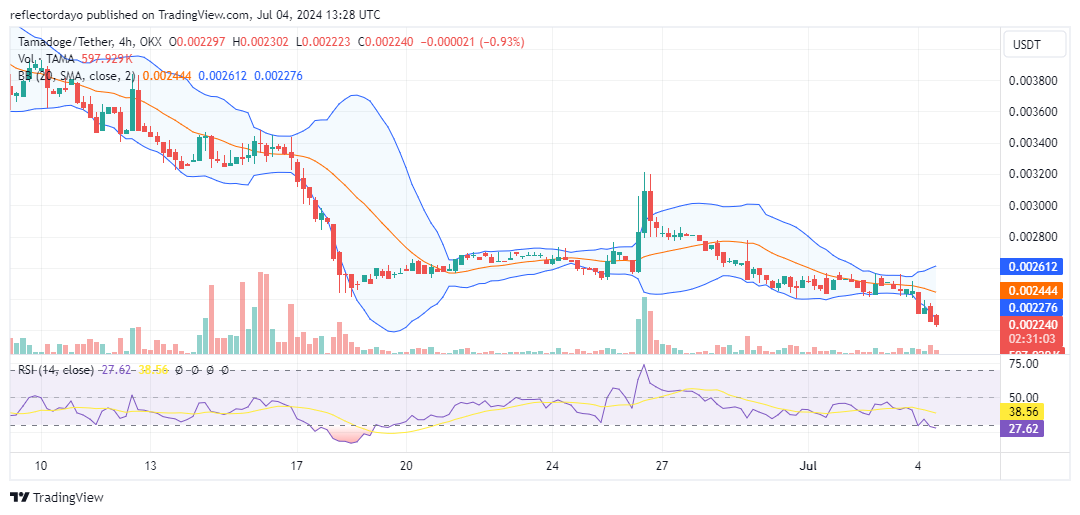
The TAMA/USD Market has fallen below the $0.0024 price level after a brief period of consolidation around that point. This sideways trend followed a significant downtrend, which began after a brief bullish trend peaked at $0.0035. Initially, it was hoped that the long-standing support level at $0.0024 would hold, but the continued bearish pressure has forced the market to seek a new support level below $0.0024.
Key Levels
- Resistance: $0.013, $0.014, and $0.015.
- Support: $0.0025, $0.0024, and $0.0023.
TAMA/USD Price Analysis: The Indicators’ Point of View
Bullish interest appears to be emerging at the $0.0022 price level, indicated by a small lower shadow on the current bearish candlestick. The market is likely to bounce from this level, aiming for the $0.0035 price point. The indicators suggest that the market may soon correct itself. Currently, the Bollinger Bands show the price action extending beyond its bands, and the RSI line has dropped below the 30 level, indicating an oversold market. Typically, crypto signals like this one may lead to a market correction, with no signs suggesting a prolonged bearish trend. Additionally, some investors may decide to buy the dip, further influencing the market towards a bullish recovery.
Tamadoge Short-Term Outlook: 1-Hour Chart
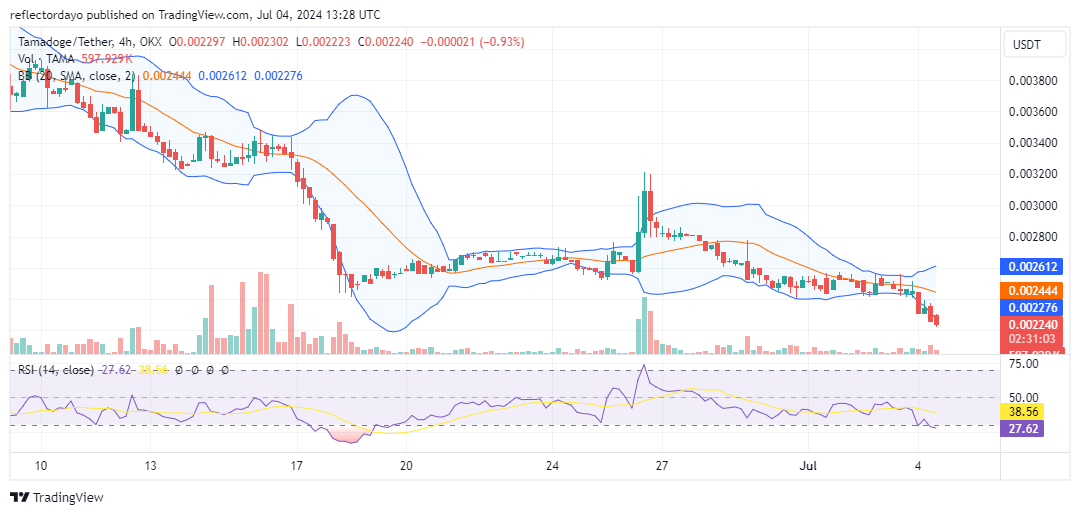
Analyzing the TAMA/USD market from a 1-hour chart perspective, the market appears to be moving sideways. The Bollinger Bands also indicate a ranging market, but recent activity shows signs of downward volatility. While this might discourage bullish traders, there are subtle indications that the market could soon start moving upward. In the last trading session on the 1-hour chart, the candlestick is small compared to the high trading volume. This discrepancy suggests a significant market struggle, potentially signaling a critical juncture. Traders should remain vigilant for the next clear market move.
Don’t forget! This week is your last chance to compete and win $TAMA rewards.
Play & Earn in the Tamaverse! 🙌
This is your last chance for the week to showcase your skills and earn some sweet $TAMA rewards. 🐶
Leaderboard ends at Midnight UTC! ⏰
Go ⬇️
📱 Android: https://t.co/D4TjX7gTFl
📱 iOS: https://t.co/0fjJapf5oA#Tamadoge #P2E #Crypto pic.twitter.com/WRAlbqNEc5— TAMADOGE (@Tamadogecoin) July 3, 2024
To buy Tamadoge click the following link. Buy TAMA today!