The 1inch Market (1INCH/USD) Establishes Strong Support Above $0.250 Price Level
Estimated Reading Time: 2 minutes
Don’t invest unless you’re prepared to lose all the money you invest. This is a high-risk investment and you are unlikely to be protected if something goes wrong. Take 2 minutes to learn more
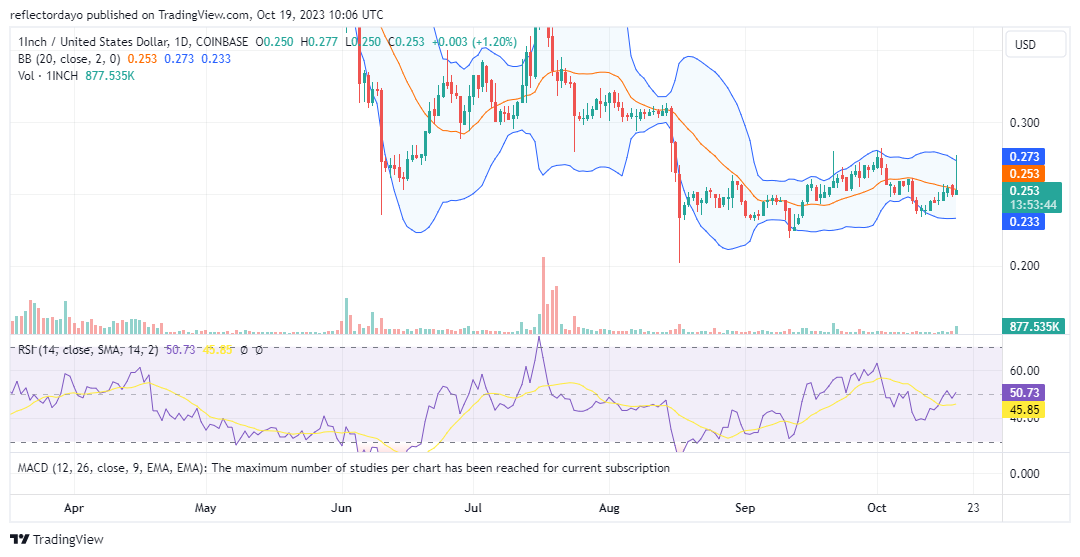
The 1inch market appears poised for a rebound following a substantial decline from the $0.306 price level in mid-August. This sharp bearish movement resulted in elevated market volatility. Bulls congregated around the $0.250 price level to establish a support zone, yet the heightened volatility induced significant fluctuations in the market, particularly around this critical price threshold. Nevertheless, it appears that the market has now established a pivotal juncture at the key $0.250 price level.
The 1inch Market Data
- 1INCH/USD Price Now: $0.255
- 1INCH/USD Market Cap: $264,766,424
- 1INCH/USD Circulating Supply: 1,042,957,553 1INCH
- 1INCH/USD Total Supply: 1,500,000,000
- 1INCH/USD CoinMarketCap Ranking: #98
Key Levels
- Resistance: $0.270, $0.300, and $0.340.
- Support: $0.250, $0.240, and $0.220.
The 1INCH Market Price Prediction: Analysis of Key Indicators
In the 1inch market, there appears to be a relatively low trading volume, contributing to increased susceptibility to significant price fluctuations around the $0.250 price level. These substantial price swings result from a limited volume of trade, which explains why today’s bull market could not maintain momentum and failed to impact the upper standard deviation curve of the Bollinger Bands indicator. This underscores the high level of market volatility, increasing the potential for bearish reversals.
1INCH/USD 4-Hour Chart Outlook
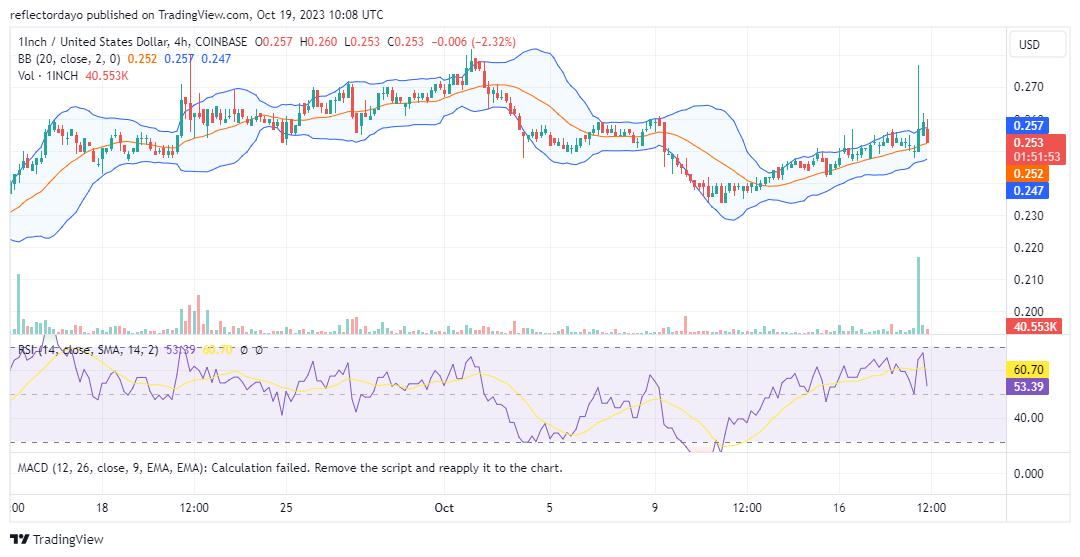
From a market analysis standpoint, the price has exhibited an upward trend since October 11, rising from levels below the pivotal $0.250 price point. During the initial 4-hour session today, a substantial surge pushed the price close to the $0.280 threshold, leading to profit-taking and a retracement to the vicinity of the 20-day moving average. Traders are advised to exercise caution given today’s market dynamics, with the emergence of a shooting star candlestick pattern in the first 4-hour session potentially signaling a price reversal.