The API3 Market (API3/USD) Surges Above $3.00
Estimated Reading Time: 2 minutes
Don’t invest unless you’re prepared to lose all the money you invest. This is a high-risk investment and you are unlikely to be protected if something goes wrong. Take 2 minutes to learn more

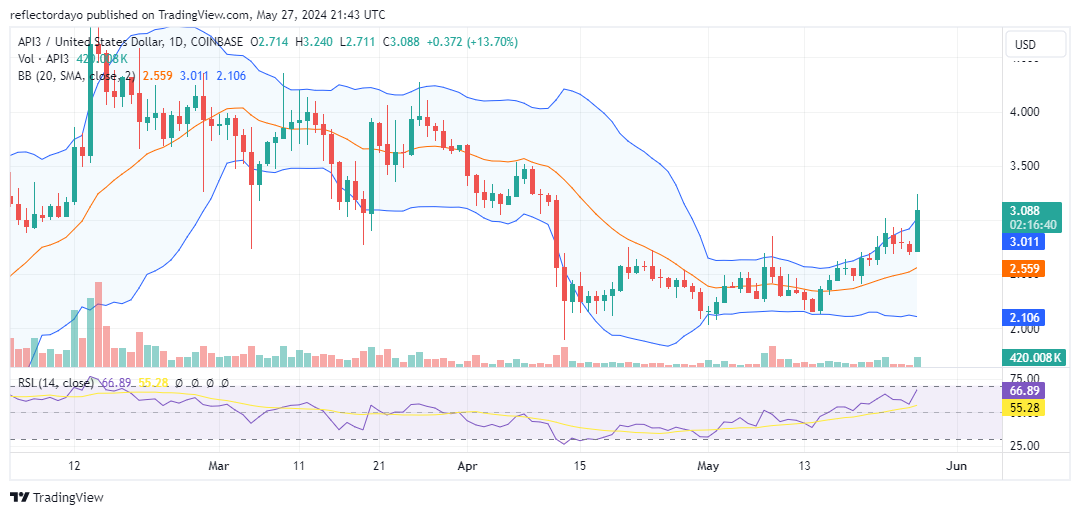
The API3 market used the $2.14 price level as a pivotal launch pad to sustain its current bull run, bringing the market above the $3.00 price level. This $2.14 level was where the bulls entered the market to halt the bearish run initiated at the $4.28 price level. Since the bullish intervention at $2.14, the market has been making higher peaks. Another higher peak was attained in today’s trading session at $3.239, and it seems some bears have been awakened at this high. As the price action turns downward, the $3.00 price level could act as a support level.
The API3 Market Data
- API3/USD Price Now: $3.075
- API3/USD Market Cap: $265 million
- API3/USD Circulating Supply: 86 million
- API3/USD Total Supply: 125 million
- API3/USD CoinMarketCap Ranking: #273
Key Levels
- Resistance: $3.25, $3.50, and $4.00
- Support: $2.70, $2.56, and $2.40.
The API3 Market Through the Lens of Indicators
Today’s trading session exhibited strong buying pressure, pushing the market above the key $3.00 price level. This market dynamic is causing the upper standard deviation band to diverge upward, indicating that prices are significantly exceeding their expected range. However, the lower standard deviation band remains near the $2.17 support level, suggesting limited downside risk. While the price action venturing beyond the upper band suggests a potential overbought condition, the continued presence of buyers near the support level is a sign of their confidence. Overall, the market exhibits a strong bullish trend.
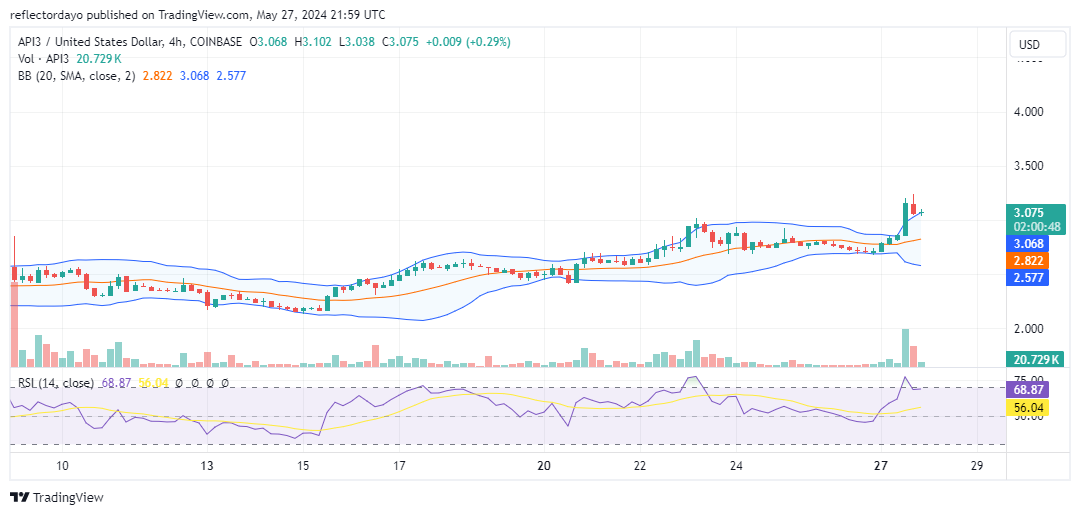
API3/USD Price Prediction: 4-Hour Chart Analysis
The 4-hour chart shows the market correcting itself from the overbought region as traders quickly took advantage of the surge to take profits. Despite this crypto signal, bullish sentiment remains high. Consequently, the $3.00 price level is acting as a support level. This is evident from the chart, as the bearish price action approaches the $3.00 level and a candlestick forms a doji, indicating prevailing bullish momentum in the market.