The Ondo Market (ONDO/USD) Stalls at $0.84: Balanced Demand and Supply Signal Period of Stability
Estimated Reading Time: 3 minutes
Don’t invest unless you’re prepared to lose all the money you invest. This is a high-risk investment and you are unlikely to be protected if something goes wrong. Take 2 minutes to learn more
In the analysis conducted on the Ondo market yesterday, it was observed that the market is endeavoring to surpass the $1.00 price threshold. However, the significance of this price level has sparked bearish sentiments. Consequently, recent market developments indicate the potential formation of a consolidation phase. Nevertheless, drawing a definitive conclusion regarding the imminent onset of this phase is challenging due to the prevailing high volatility levels.
The Ondo Market Data
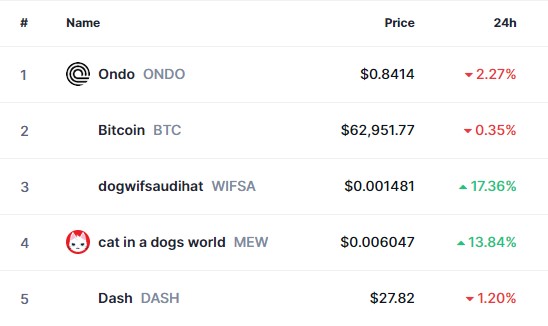
- ONDO/USD Price Now: $0.8471
- ONDO/USD Market Cap: $1.2 billion
- ONDO/USD Circulating Supply: 1.4 billion
- ONDO/USD Total Supply: 10 billion
- ONDO/USD CoinMarketCap Ranking: #73
Key Levels
- Resistance: $1.00, $1.50, and $2.00.
- Support: $0.80, $0.75, and $0.70.
The Ondo Market Through the Lens of Indicators
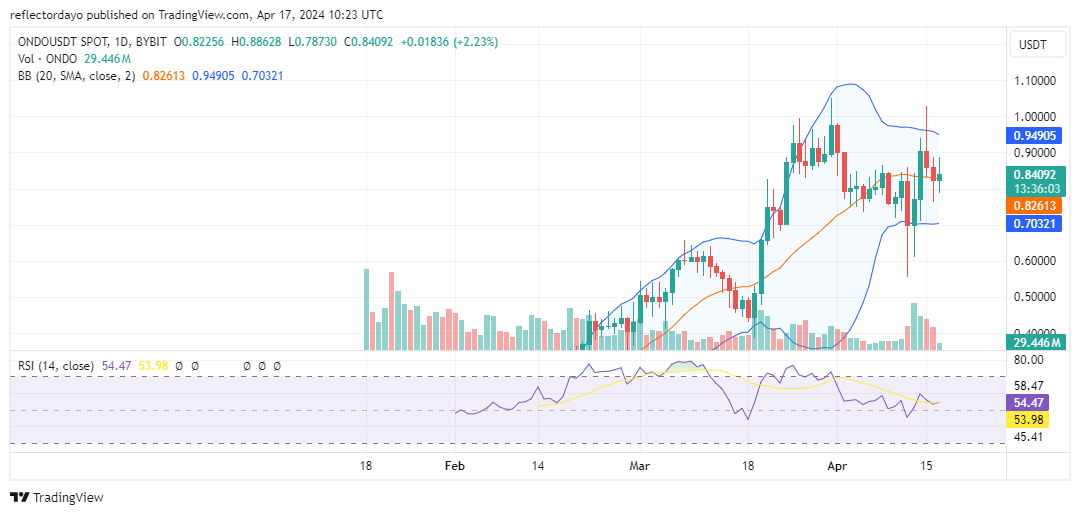
The current candlestick, depicting today’s trading activities in the Ondo market, exhibits a small body accompanied by long upper and lower shadows, characteristic of a spinning top candlestick pattern. This pattern suggests heightened volatility, with significant price fluctuations reflecting dynamic shifts in supply and demand throughout the day. Notably, the presence of both bullish and bearish forces indicates a standoff, resulting in a market stalemate. Consequently, the market is currently experiencing sideways movement, indicating a consolidation phase accompanied by elevated volatility levels.
Given the prevailing conditions of this crypto signal, predicting the market’s next directional movement proves challenging, particularly as today’s candlestick hovers around the 20-day moving average. However, sustaining a position above the 20-day moving average could signal a reluctance to reverse, potentially paving the way for an upward breakout beyond the $1.00 price level.
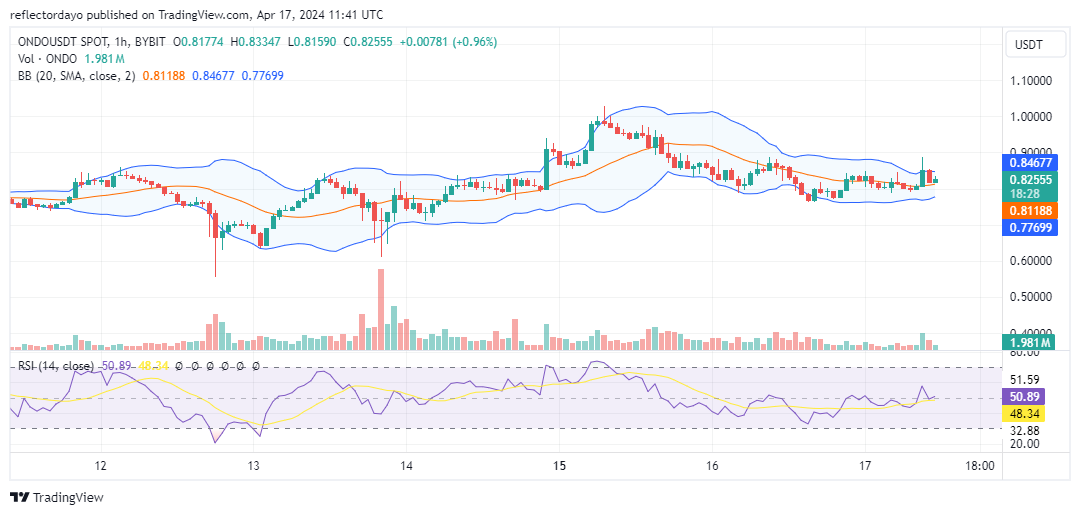
Ondo Price Prediction: 4-Hour Chart Analysis
From the analysis of the 4-hour chart, volatility seems subdued, with a marginal advantage held by the bulls as they have managed to sustain prices slightly above the 20-day moving average. However, it is noteworthy that the bulls have yet to decisively surpass the resistance posed by the bears, as evidenced by the Relative Strength Index (RSI) hovering near the 50 level. This suggests that the market remains in a state of equilibrium, with neither bulls nor bears exhibiting significant dominance. This equilibrium phase may persist for some time, given that momentum appears to be waning for both sides, as observed on this timeframe chart.


