The Sei Market (SEI/USD) Strives to Rebound from Yearly Low
Estimated Reading Time: 2 minutes
Don’t invest unless you’re prepared to lose all the money you invest. This is a high-risk investment and you are unlikely to be protected if something goes wrong. Take 2 minutes to learn more

The Sei market peaked above the $1.10 price level in March of this year. The ensuing bear market drove the price down to a yearly low of $0.245. At this level, the market is attempting to establish significant support, which could form the basis for an upward price surge moving forward.
Sei Market Data
- SEI/USD Price Now: $0.29
- SEI/USD Market Cap: $120 million
- SEI/USD Circulating Supply: 3 billion
- SEI/USD Total Supply: 10 billion
- SEI/USD CoinMarketCap Ranking: #69
Key Levels
- Resistance: $0.35, $0.40, and $045
- Support: $0.25, $0.20, and $0.15.
The Sei Market Through the Lens of Indicators
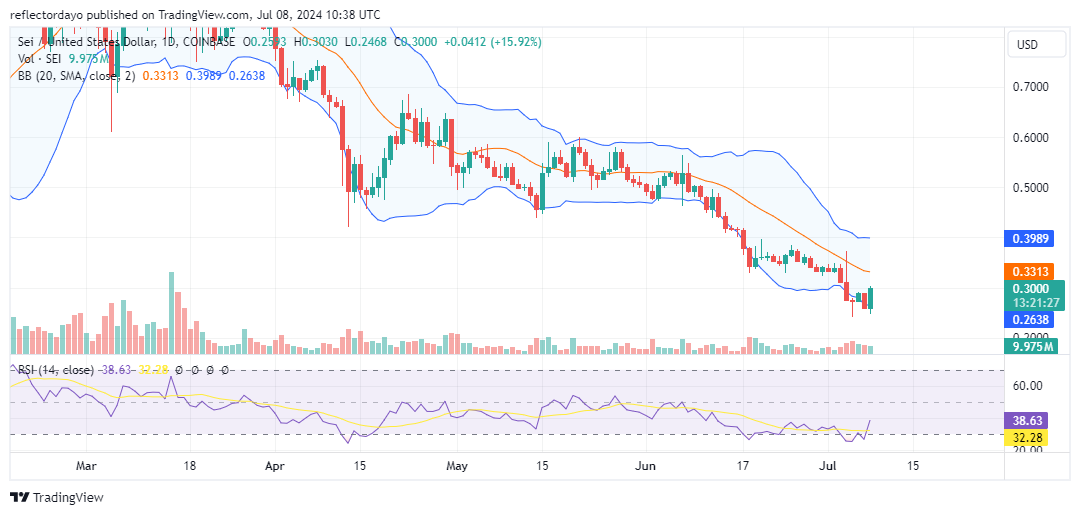
Since the onset of the bearish trend following the peak of the bullish run in March, the market has been performing predominantly below key indicators’ midpoints. The price action has mostly remained below the 20-day moving average, indicating a strongly bearish market. In April, the Sei market found support around the $0.50 price level, withstanding bearish pressure until June. Recently, the price bounced back to around $0.29 after bearish pressure drove it to a yearly low of $0.245. This rebound, marked by a significant bullish candlestick representing today’s trading activities, could signal the end of the bear run. However, traders should critically consider this crypto signal, they should watch for the market breaking above the slanting trendline, which would indicate the beginning of a turnaround.
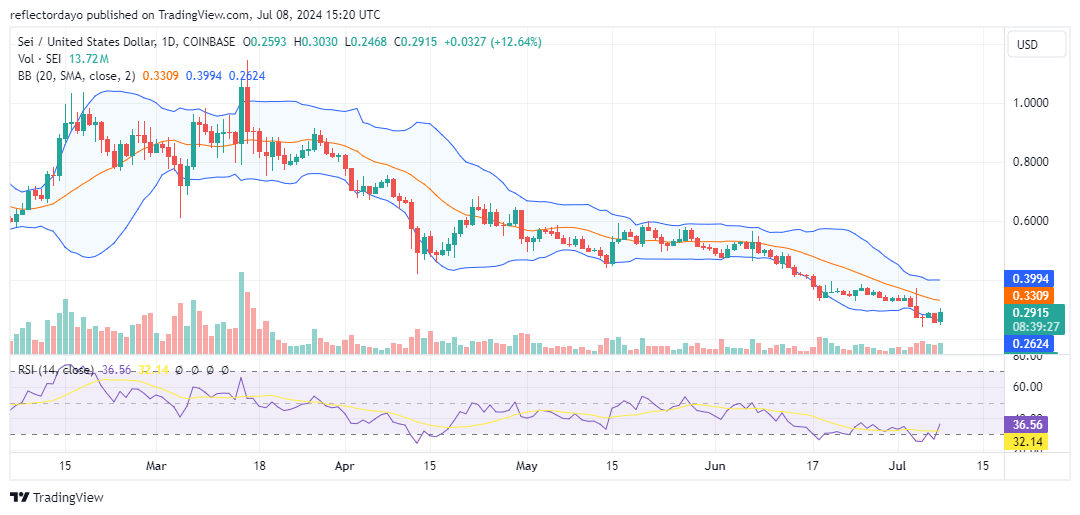
SEI/USD Price Prediction: 4-Hour Chart Analysis
Zooming in on the 4-hour chart, we observe a significant surge in price action; however, the Bollinger Bands fail to reflect movement in the upper standard deviation. This indicates that the bull market is encountering resistance at the $0.30 price level. Breaking through this level will be crucial in determining whether the Sei bull run can continue without exhaustion.