The Sui Market (SUI/USD) Soars Amid Bullish Momentum, Eyes Support Around $2.78
Estimated Reading Time: 3 minutes
Don’t invest unless you’re prepared to lose all the money you invest. This is a high-risk investment and you are unlikely to be protected if something goes wrong. Take 2 minutes to learn more
The Sui (SUI/USD) market is experiencing a significant bullish breakout that began yesterday and has extended into today’s session. Buyers have maintained aggressive control, fueling a consistent upward push and injecting substantial liquidity into the market.
This surge in buying interest has tilted market sentiment heavily in favor of the bulls, driving up volatility. However, signs of profit-taking are emerging, as indicated by the upper wicks on recent bullish candlesticks—suggesting that some traders are securing gains as prices rise.
With the price now approaching the psychological resistance at $3.00, the bullish momentum may face its first major test. This level could attract selling pressure from bears aiming to capitalize on the rally. Nevertheless, if bulls manage to overcome this barrier, the $2.78 level may establish itself as a higher support zone in the event of a pullback.
The Sui Market Data
SUI/USD Price Now: $2.78
SUI/USD Market Cap: $9.5 billion
SUI/USD Circulating Supply: 3.2 billion SUI
SUI/USD Total Supply: 10 billion SUI
SUI/USD CoinMarketCap Ranking: #12
Key Levels
- Resistance: $3.00, $3.50 and $4.00
- Support: $2.50, $2.00, and $1.50
The Sui Market Technical Outlook: Bullish Momentum Tests $3.00 After Breaking Consolidation
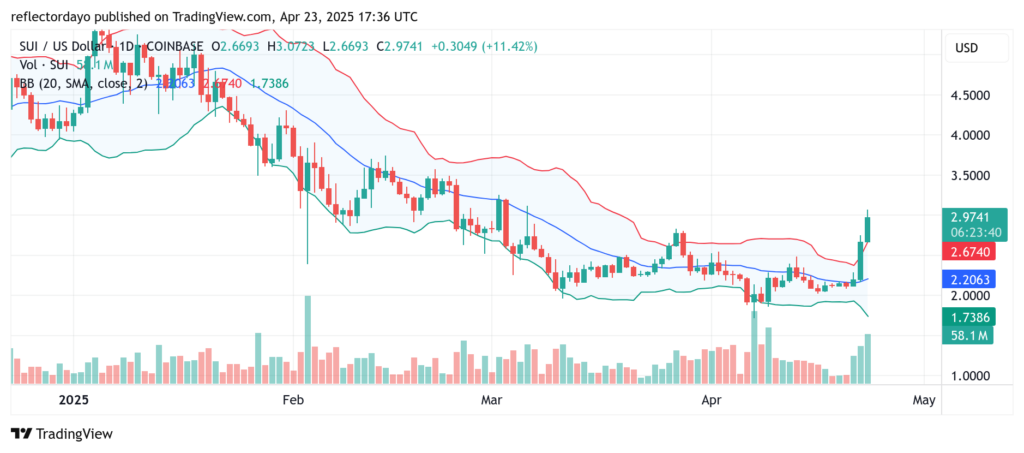
Previously, the Sui (SUI/USD) market had been consolidating below the $2.78 resistance level, following a bearish trend that began in early January and pushed the price beneath this critical threshold on March 4. Since then, the market has.
remained subdued, trading sideways until a bullish breakout emerged yesterday.
During the previous trading session, a strong bullish bias lifted the price from the $2.20 level, propelling it toward the $3.00 mark—where the market is currently facing resistance. This impressive upward movement has caused the Bollinger Bands to widen, signaling an increase in market volatility.
While the bullish pressure is evident, the $3.00 resistance level may present a short-term hurdle. However, this momentum shift creates the potential for bulls to establish a higher support zone. At present, the $2.78 level appears to be a likely candidate for this new support, marking a critical point for future price action.
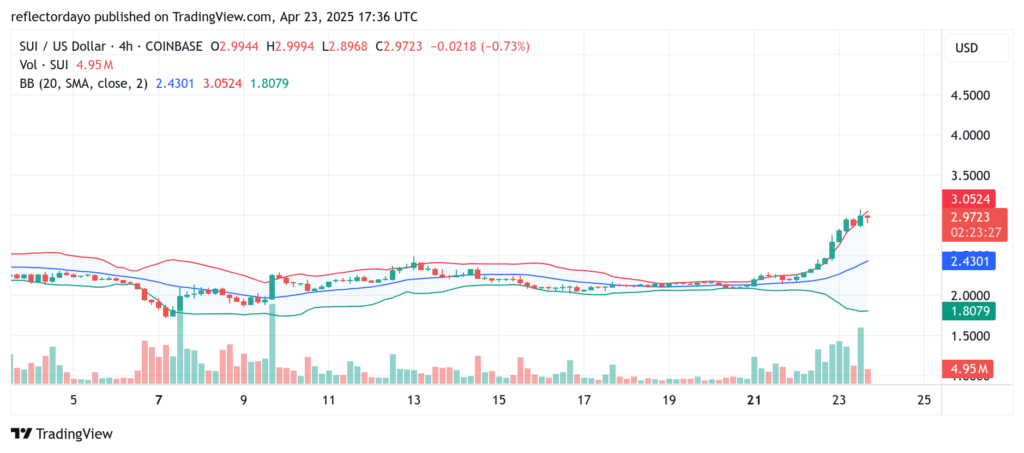
SUI/USD 4-Hour Chart Analysis: Bullish Momentum Faces Key Resistance at $3.00
The widening of the Bollinger Bands observed on the daily chart is also evident on the 4-hour timeframe, signaling increased market volatility. At present, SUI/USD is encountering notable resistance at the $3.00 level—a critical psychological and technical barrier.
Additionally, declining trading volume suggests that bullish momentum may be weakening, raising the possibility of a corrective pullback. In such a scenario, the price may struggle to hold above the likely support at $2.78.
However, if bulls can sustain their current momentum and regain control, the uptrend may resume, potentially leading to a breakout above the $3.00 resistance. The next few sessions will be pivotal in determining the market’s short-term direction.