Toncoin (TON/USD) Breaks Resistance: Is a Sustained Rally Ahead?
Estimated Reading Time: 3 minutes
Don’t invest unless you’re prepared to lose all the money you invest. This is a high-risk investment and you are unlikely to be protected if something goes wrong. Take 2 minutes to learn more
For the past two months, the $4.00 price level has served as a key resistance level. Since Toncoin bears took control of this level on February 3, they have firmly maintained their position. The resistance here has constrained market liquidity below this critical threshold.
Shortly after the Toncoin price found support at $2.39, traders began accumulating, leading to a swift surge toward the $4.00 level. While this rapid rally was expected to face rejection, optimistic traders sustained their momentum, keeping the market near this resistance level.
Toncoin Market Data
- TON/USD Price Now: $4.1
- TON/USD Market Cap: $10 billion
- TON/USD Circulating Supply: 2.5 billion
- TON/USD Total Supply: 10 billion
- TON/USD CoinMarketCap Ranking: #11
Key Levels
- Resistance: $4.5, $5.0, and $5.5
- Support: $4.00, $3.50, and $3.00.
Toncoin Through the Lens of Indicators
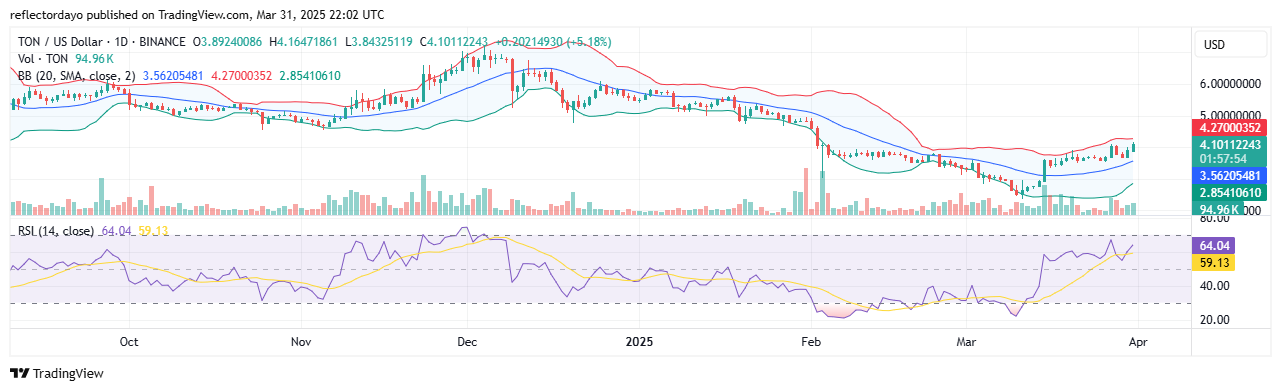
The strength of the resistance at the $4.00 price level has been evident for some time, as bullish momentum has repeatedly failed to push Toncoin price beyond this threshold. However, in recent sessions, including today’s trading, the price has been gradually breaking through this resistance, currently standing at $4.10.
Technical indicators suggest that there is still room for further bullish movement. The RSI currently measures 64, indicating strong momentum while remaining below overbought territory. Despite this crypto signal, traders remain cautious, with some awaiting confirmation—possibly a decisive break above the nearby resistance at $4.13.
Additionally, today’s bullish momentum is supported by histogram readings, which indicate substantial trading activity, adding credibility to the ongoing price action.
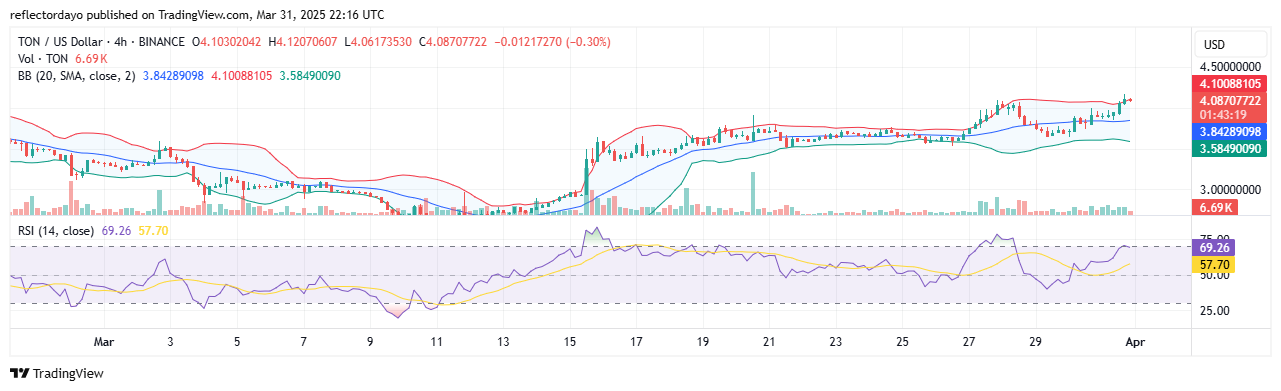
TON/USD Price Outlook: 4-Hour Chart Analysis
To further assess the market’s condition, we analyze a smaller timeframe, such as the 4-hour chart. So far, the price has sustained its position above the $4.00 level, with substantial trading volume continuing even on this shorter timeframe. However, the bullish momentum appears to be weakening, suggesting that the rally may be losing steam. At this point, the market needs a support level above $4.00 to maintain its upward trajectory.
A small bearish candlestick has emerged following a shooting star pattern, while momentum hovers near overbought territory, indicating that the price is beginning to pull back. Nevertheless, bullish sentiment remains present, keeping the market buoyant. The next daily trading session may provide further clarity on the market’s next move.