Top Trending Coins for Today, June 30: BTC, ETH, USDT, BNB, SOL
Estimated Reading Time: 6 minutes
Don’t invest unless you’re prepared to lose all the money you invest. This is a high-risk investment and you are unlikely to be protected if something goes wrong. Take 2 minutes to learn more
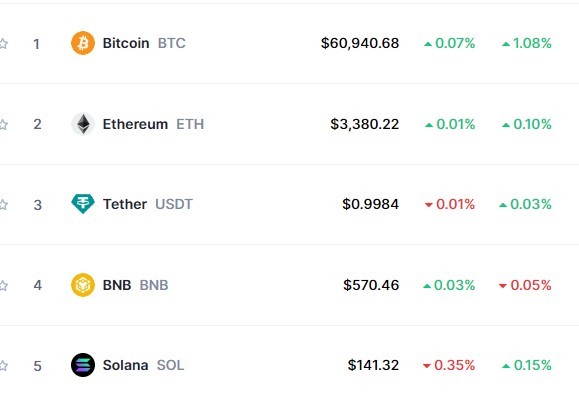
This week’s trending cryptocurrencies are experiencing significant price declines, resulting in a major reshuffle of the market. New cryptocurrencies have replaced most of the previous week’s top tokens. Only Bitcoin (BTC) has remained on the list of top trending markets. In addition to BTC, Ethereum (ETH) has also made the list this week. Surprisingly, Tether (USDT), a stablecoin, has secured the third position. Although unusual for a stablecoin to feature prominently, increased search interest may have driven its inclusion. Let’s delve deeper into the performance of these two persistent cryptocurrencies.
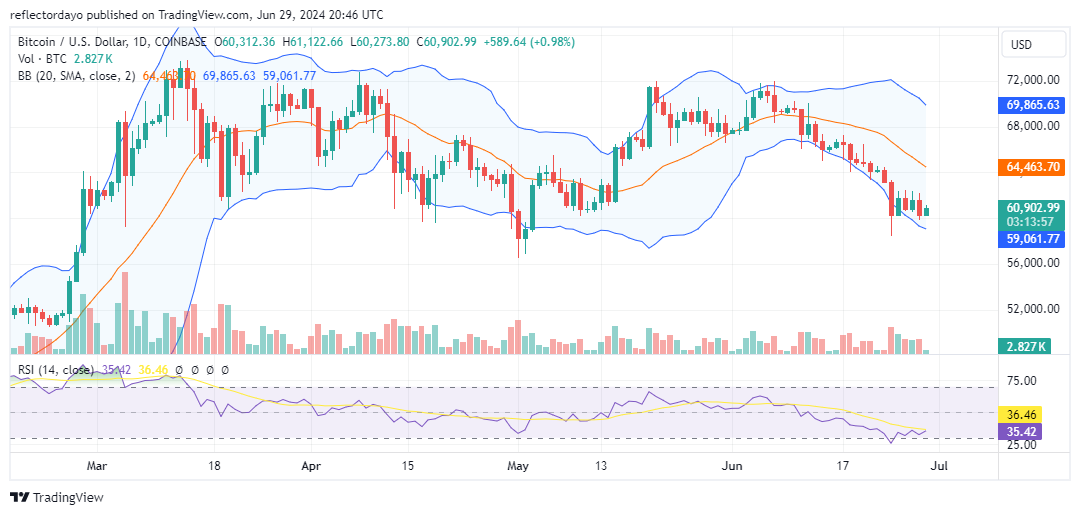
Bitcoin (BTC)
Major Bias: Bearish
For a while now, the Bitcoin (BTC) market has been bearish after encountering resistance at the $72,000 price level, which has been a significant barrier for some time. The market was particularly volatile on June 7, and once the price hit $72,000, it began to decline. The sell-off was substantial, causing the price to fall below $60,000. However, bullish traders intervened at this level, preventing a further decline and reinforcing the $60,000 support level. This suggests that the market is unlikely to fall below this threshold.
The Bollinger Bands indicator illustrates bearish momentum, with the lower standard deviation diverging more, reflecting the declining price action. The price is moving well below the 20-day moving average and is approaching the lower Bollinger Band. Similarly, the RSI line is moving sideways near the 30 level threshold, indicating that although some investors have taken advantage of the lower prices to buy the dip, the market remains under significant bearish pressure.
Examining the chart, there is noticeable resistance near the $60,000 level, specifically at $62,372. The price has been rejected at this level several times. Therefore, breaking through this resistance would signify a significant turnaround for Bitcoin, potentially leading to another rally towards $72,000.
Current Price: $60,965.80
Market Capitalization: $1.2 trillion
Trading Volume: $14 billion
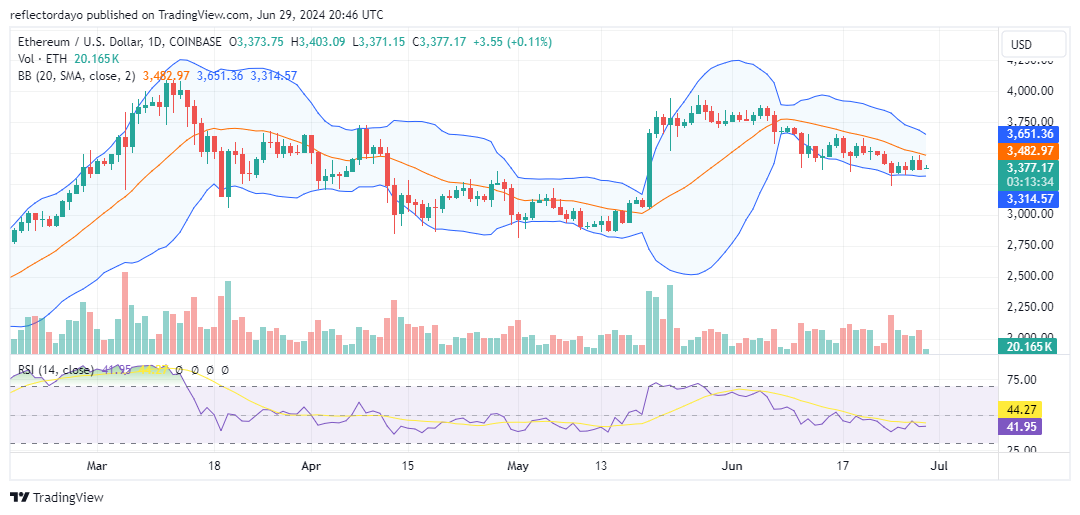
Ethereum (ETH)
Major Bias: bearish
As the leading cryptocurrency, BTC‘s movements significantly impact other markets, including Ethereum. Ethereum has also declined from its $3,900 price threshold, but its decline has been more gradual compared to Bitcoin. Currently, Ethereum is resting at $3,380, holding onto the support level at $3,339.47. Despite a marginal recovery, the market still shows signs of pressure from the supply side.
Today’s trading activities indicate that the market is consolidating at the current price level, with traders showing signs of indecision. Both the Bollinger Bands indicator and the Relative Strength Index (RSI) indicate bearish conditions, with the market ranging sideways. At present, there are no signs of an impending strong market movement, as the trading volume appears low, reflected by the size of today’s histogram.
Current Price: $3,376
Market Capitalization: $ 406 billion
Trading Volume: $7 million
Tether (USDT)
Major Bias: Indecision
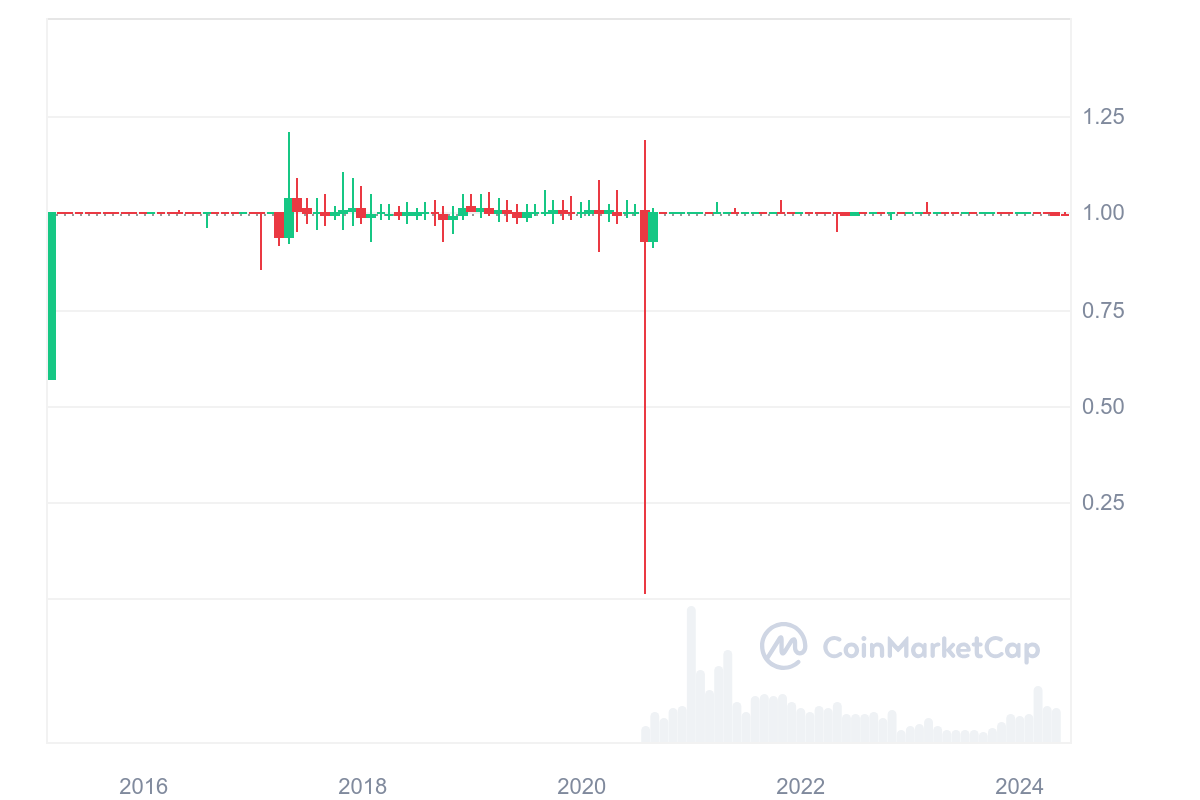
The surprising entry of the Tether (USDT) market may raise some questions, as Tether is a stablecoin designed to remain stable with minimal volatility around the $1.00 price level. So far in today’s market, Tether has neither gained nor lost value in the past hour, showing a minor 0.02% gain in the past 24 hours and a 0.15% loss over the past seven days.
Aside from notable profitability and volatility over the past week, one of the key factors that can propel a market into the top trending list on CoinMarketCap is its popularity and high search volume during the week or the past 24 hours.
Current Price: $0.9983
Market Capitalization: 112 million
Trading Volume: $28 million
BNB (BNB)
Major Bias: Indecision
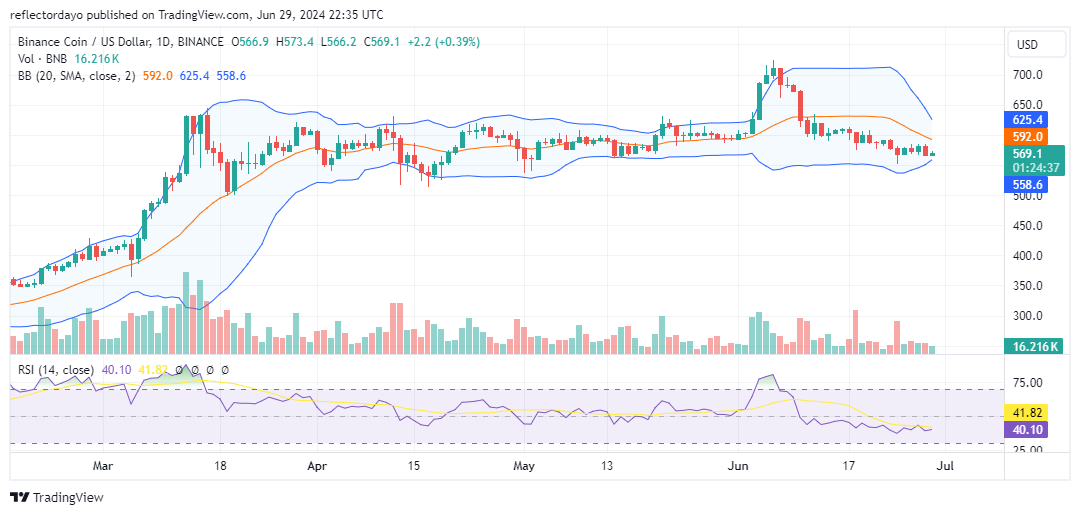
Although the BNB market continues to range sideways, it remains below the 20-day moving average, emphasizing the overall bearish trend across the crypto market. The market has been moving sideways along the $561 support level since early April when bulls identified this level. The continuous defense of this support level has bolstered its significance for future price action.
Recently, bullish activities caused volatility to surge, with prices reaching above $700 before profit-taking set in. These profit-taking activities have brought the price down to $564.8. The support at this level has calmed volatility, and based on historical performance, it is unlikely that the price will fall below this level. Instead, it is probable that the price will once again retrace to above the $700 level.
Current Price: $568
Market Capitalization: $84 million
Trading Volume: $1.4 million
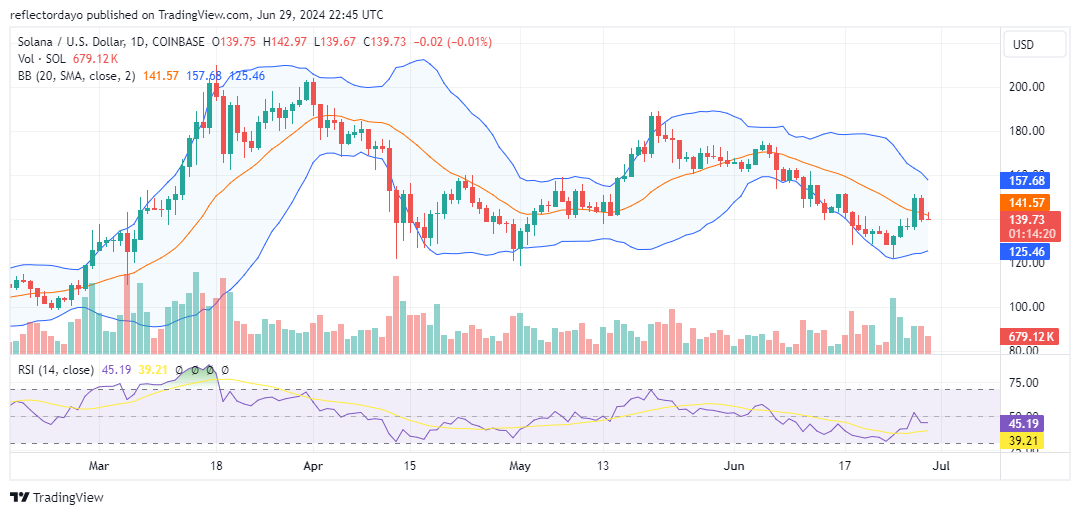
Solana (SOL)
Major Bias: Indecision
This week, the Solana market holds the fifth position, and it is notably the only market demonstrating substantial bullish volatility. The impressive upward performance began after the market hit a low of $121 on Monday, June 24. This dip spurred bullish interest, driving the market significantly upward, resulting in a 4.16% gain over the last seven days. Currently, the price stands at $139, with the $140 price level acting as support. However, the outlook of the current daily trading session indicates a potential reversal. The presence of a gravestone doji candlestick suggests that the price may soon dip below the $140 support level.
Current Price: $139
Market Capitalization: $64 trillion
Trading Volume: $1.1 billion