Tornado Cash (TORN/USD) Surges from $2.50 to $40 Before Correcting to $20.99: What’s Next?
Estimated Reading Time: 4 minutes
Don’t invest unless you’re prepared to lose all the money you invest. This is a high-risk investment and you are unlikely to be protected if something goes wrong. Take 2 minutes to learn more

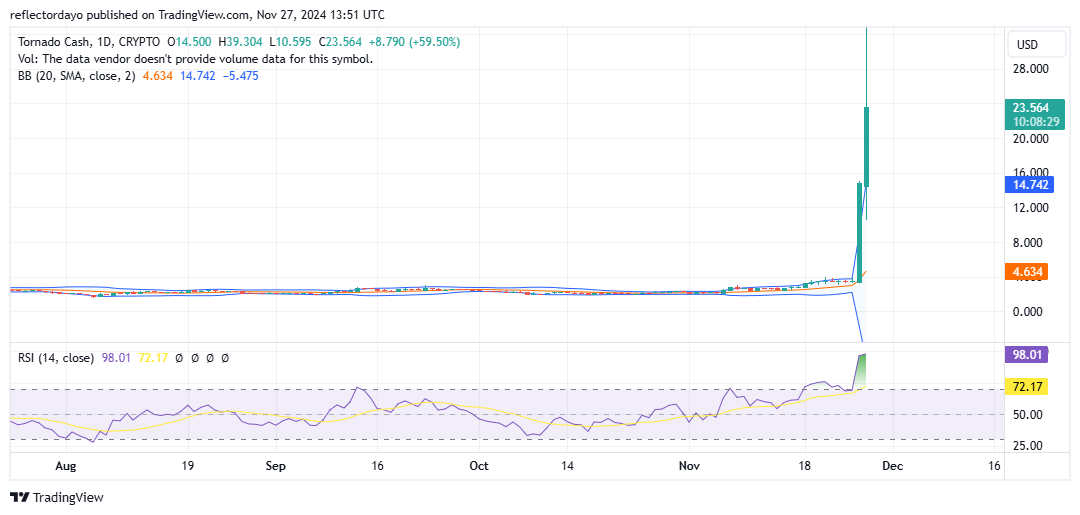
In a surprising and exciting turn of events, the Tornado Cash market, which had remained stable for nearly a year, maintaining a conservative range between $2.00 and $3.00, has finally broken out in a bullish and explosive manner. The market surged from the $2.50 price level to an impressive peak of $40 before traders began taking profits.
This remarkable movement has undoubtedly rewarded long-term holders who maintained their positions through the extended consolidation phase. Moreover, this breakout might signal the beginning of a sustained upward trend for the market.
Currently, the market appears to have established support around $20.99, suggesting the possibility of another upward move in the near future. This could mark a pivotal moment for Tornado Cash as it continues to gain value and attract increased attention from traders and investors alike.
Tornado Cash Market Data
- TORN/USD Price Now: $23.564
- TORN/USD Market Cap: $104.34 million
- TORN/USD Circulating Supply: 5.26 million
- TORN/USD Total Supply: 10 million
- TORN/USD CoinMarketCap Ranking: #447
Key Levels
- Resistance: $25.00, $30.00, and $35.00
- Support: $20.00, $16.00, and $12.00.
Tornado Cash Market Through the Lens of Indicators
The prolonged consolidation phase, which kept the market ranging between the $2.00 and $3.00 zone, appears to have provided ample time for investors to accumulate positions. This accumulation may explain the sudden, massive bullish breakout. As Tornado Cash soared higher, it likely attracted increased bullish sentiment, even after some traders took profits at the peak of $40.
Technical indicators highlight the extraordinary nature of this price movement. The Bollinger Bands have widened significantly, signaling extreme volatility, while the Relative Strength Index (RSI) has reached an exceptionally overbought level of 97. Despite these conditions, some traders remain optimistic, leading to a standoff between bullish and bearish sentiments around the $20 level.
Currently, the crypto signal is fluctuating actively between $20 and $23, reflecting its heightened volatility. Notably, $20 appears to serve as a key support level, as the market consistently bounces from this point. This suggests the possibility of the market establishing a higher support platform.
If the tug-of-war between demand and supply persists, the market could resume its upward trajectory from this level, potentially paving the way for further gains.
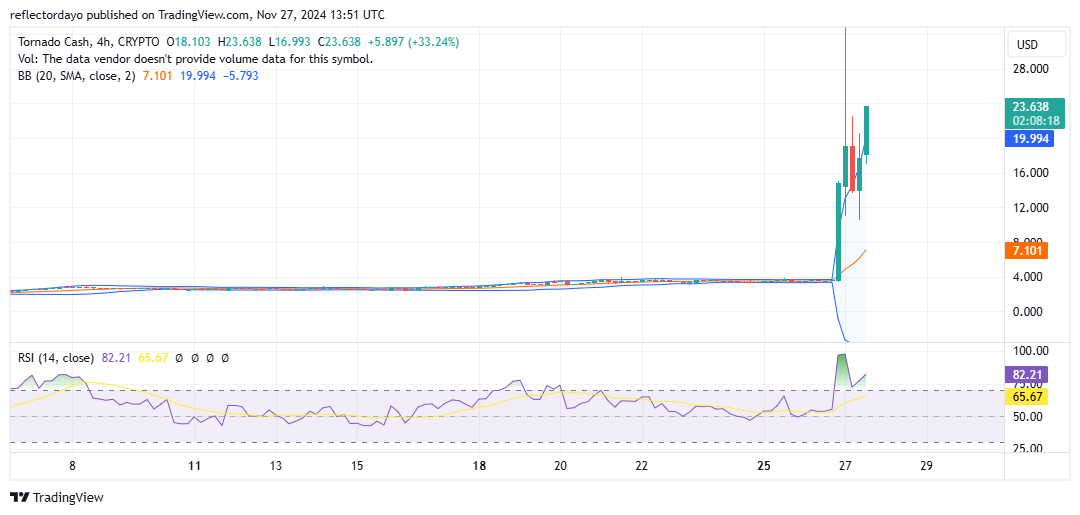
TORN/USD Price Prediction: 4-Hour Chart Analysis
Due to the strong bullish sentiment and heightened volatility, the market has managed to scale price levels with minimal resistance from bearish pressure. The price movement has been remarkably fast and volatile, fluctuating around the $20 level. In the current 4-hour trading session, the price even reached a peak of $24, as indicated by the upper shadow on the candlestick chart.
Given the current indicator readings, investing at this stage carries significant risk due to the market’s instability. While the $20 level appears to be establishing itself as a new support zone, the elevated volatility suggests that the market could continue to experience erratic price swings.
Despite these challenges, the market is likely to maintain its upward trajectory, with a return to the previous consolidation range being highly improbable. Investors should exercise caution but remain attentive to potential opportunities as the market develops.