Binance Coin Is in a Sideways Move, Bearish Trend May Resume
Estimated Reading Time: 2 minutes
Don’t invest unless you’re prepared to lose all the money you invest. This is a high-risk investment and you are unlikely to be protected if something goes wrong. Take 2 minutes to learn more
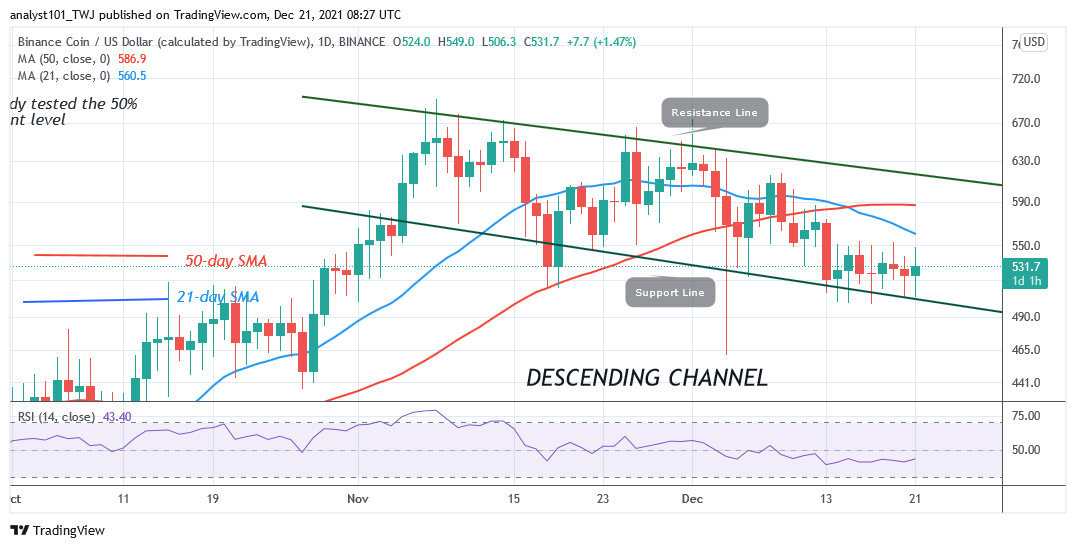

Binance Coin (BNB) Long-Term Analysis: Bearish
Binance Coin’s (BNB) price is in a downward correction but bearish trend may resume. Sellers have pushed the cryptocurrency to the low of $504. The crypto bounces above the current support to resume upward. The upward corrections are facing resistance at the $540 high. The selling pressure will continue if the altcoin faces rejection at the recent high. However, if buyers break above the moving averages and the bullish momentum is sustained, it will signal the resumption of the uptrend. For now, the price movement is under the control of sellers. Today, the market may decline as it faces rejection at $540.
Binance Coin (BNB) Indicator Analysis
BNB has risen to level 43 of the Relative Strength Index for period 14. It indicates that the altcoin is in the downtrend zone and below the centerline 50. BNB is above the 20% range of the daily stochastic. The bullish momentum is unstable as the altcoin fluctuates above the current support.
Technical indicators:
Major Resistance Levels – $640, $660, $680
Major Support Levels – $540, $520, $500
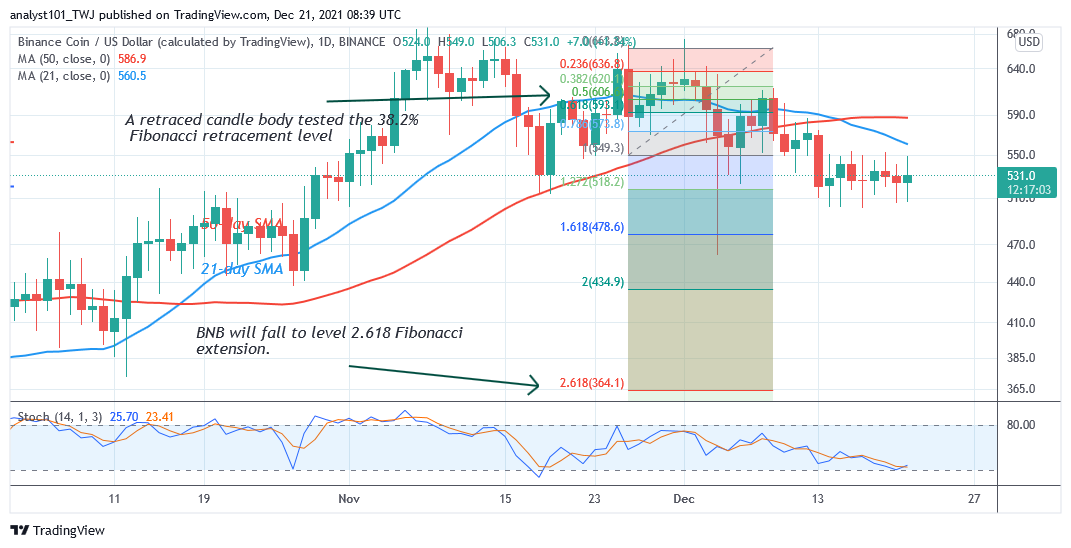
What Is the Next Direction for Binance Coin (BNB)?
On the daily chart, BNB/USD is consolidating above the $500 support but bearish trend may resume. After December 13, bearish impulse, the altcoin has been consolidating above the current support but fluctuates between $500 and $550. Meanwhile, on November 26 downtrend; a retraced candle body tested the 38.2% Fibonacci retracement level. The retracement indicates that Binance Coin will fall to level 2.618 Fibonacci extension or $364.10.
You can purchase crypto coins here. Buy Tokens
Note: Cryptosignals.org is not a financial advisor. Do your research before investing your funds in any financial asset or presented product or event. We are not responsible for your investing results