UMA Token (UMA/USD) Bulls Step In, Slowing Bearish Momentum
Estimated Reading Time: 3 minutes
Don’t invest unless you’re prepared to lose all the money you invest. This is a high-risk investment and you are unlikely to be protected if something goes wrong. Take 2 minutes to learn more
In recent daily trading sessions, there has been a significant increase in trading volume, despite the overall market sentiment remaining bearish. The prolonged downtrend has driven the UMA token price down from a high of nearly $4.50 to its current level, approaching $1.00. However, as the market nears this key level, there appears to be a growing bullish bias among traders, suggesting the possibility of a price recovery or rebound.
The Universal Market Access Market Data
- UMA/USD Price Now: $1.29
- UMA/USD Market Cap: $111.5 million
- UMA/USD Circulating Supply: 85.8 million UMA
- UMA/USD Total Supply: 123.9 million UMA
- UMA/USD CoinMarketCap Ranking: #311
Key Levels
- Resistance: $2.00, $3.00, and $4.00
- Support: $1.00 $0.90, and $0.80
The UMA token Through the Lens of Indicators
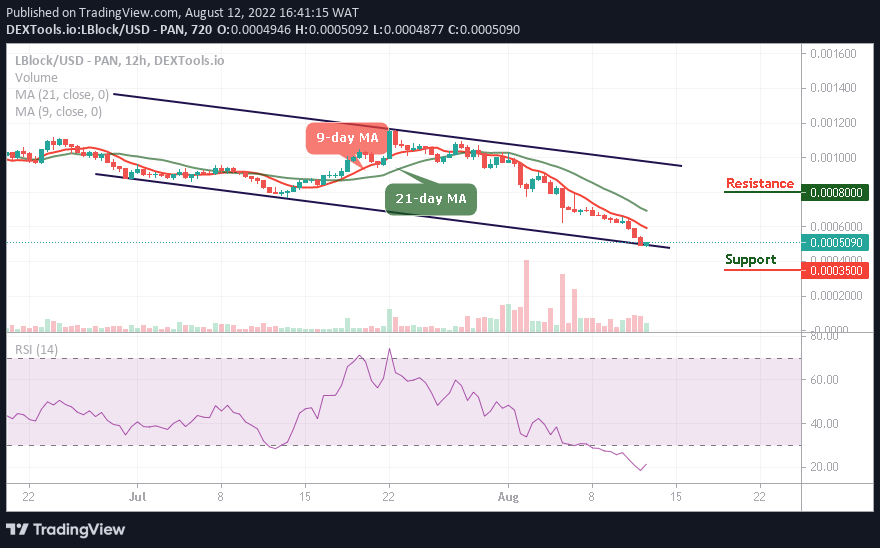
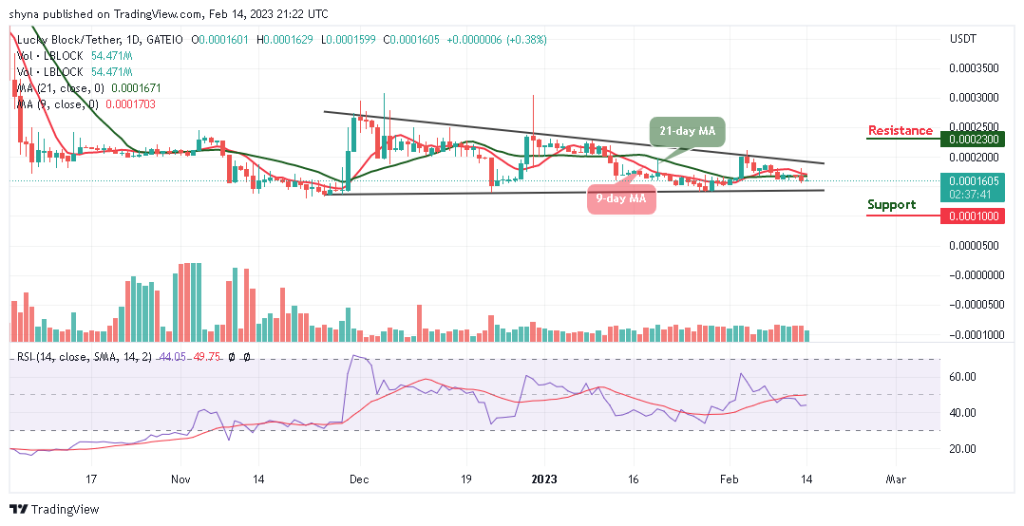
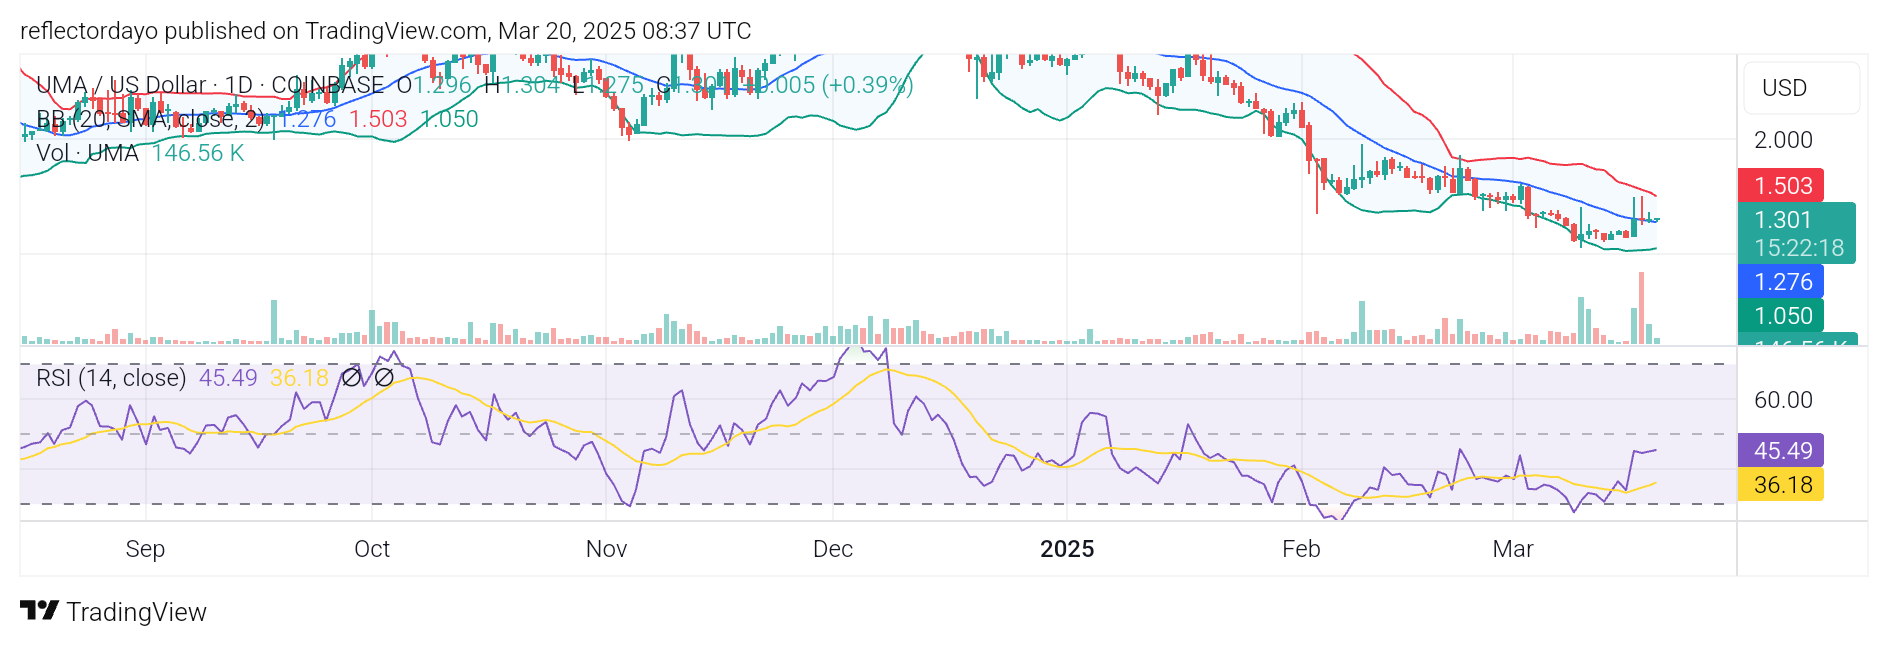
The prolonged downtrend in market price action, or bear market, began after the UMA token peaked near the $4.50 price level on December 8 of last year. The subsequent bearish run led to a breakdown below the critical $2.00 support level, which had provided stability for a significant period. This breakdown in the crypto signal further reinforced bearish sentiment among traders, driving the price lower toward the key $1.00 level.
Recently, over the past three days, trading volume histograms have surged significantly, diverging from the overall downtrend. This surge in volume suggests a growing bullish bias despite the prevailing bearish market conditions. As a result, buying pressure around the $1.00 level has managed to push the price up to $1.30, where the market currently holds firm in a state of equilibrium.
Given this development, price action may consolidate at this level, allowing bearish momentum to weaken. If this consolidation phase holds, it could set the stage for a potential bullish recovery.
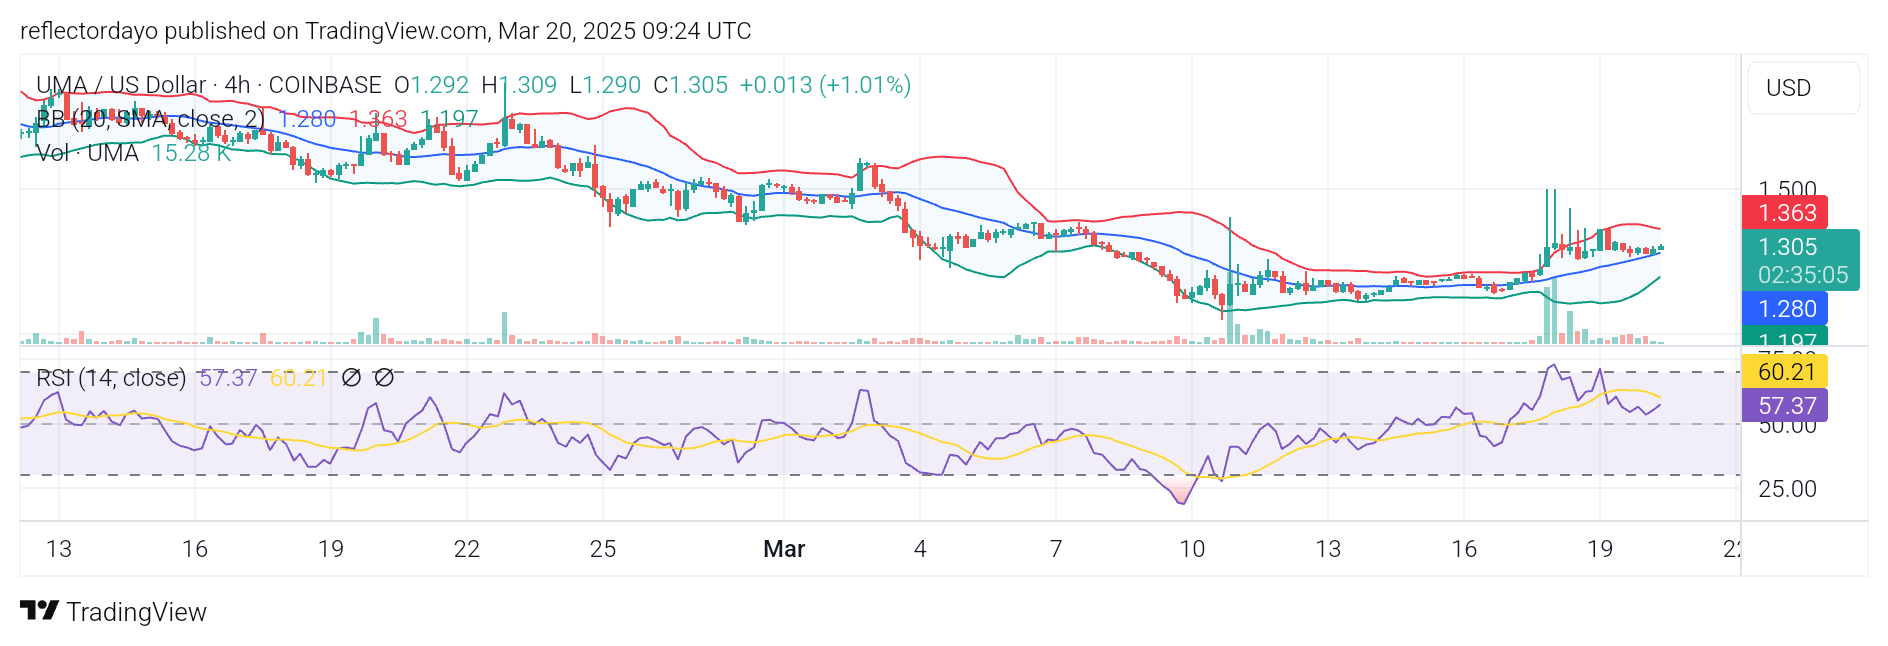
UMA/USD Price Prediction: 4-Hour Chart Analysis
By zooming into the 4-hour chart, we can see that the buildup of bullish sentiment around the $1.00 level was strong, with traders showing confidence that the market would not break below this key support. This led to a surge in buying pressure, resulting in a spike in volatility that quickly pushed the price up to the $1.50 resistance level.
Currently, the price has stabilized around $1.30, creating a state of equilibrium. A breakout or breakdown from this level will determine the market’s next direction. If the market breaks below $1.30, recent price action suggests that the $1.00 support level may be tested again.