A token unlock happens when previously locked tokens become available to investors, teams, foundations, or other holders. These events matter because they can increase circulating supply and affect market expectations.
Many crypto projects lock tokens after launch. This is common for team allocations, venture investors, ecosystem funds, or staking rewards. The lockup schedule is usually published in tokenomics documents. When unlock dates arrive, holders may be allowed to sell, transfer, or use those tokens.

Unlocks do not always cause price drops. If the market expects the event, the impact may already be priced in. If recipients do not sell, supply may not hit the market immediately. Strong demand can also absorb new supply.
However, large unlocks can create pressure, especially when market sentiment is weak. If a project unlocks a large percentage of circulating supply and early investors are sitting on profits, traders may become cautious. Even the fear of selling can affect price before the unlock happens.
The size of the unlock matters. A small routine unlock may be irrelevant. A major cliff unlock, where a large batch becomes available at once, deserves more attention. Traders should compare the unlock value with daily trading volume and market cap.

Who receives the tokens also matters. Team unlocks, investor unlocks, ecosystem grants, and staking rewards can have different selling behaviour. Venture funds may have different time horizons from community users.
For trading, token unlocks are best used as a risk filter. If a coin has a bearish chart and a large unlock next week, it may be better to wait. If a coin absorbs an unlock without breaking support, that can sometimes be a sign of strength.
Key takeaway:
Token unlocks increase available supply, but their price impact depends on size, timing, market conditions, and holder behaviour. They are not automatic sell signals, but they should be on the calendar.
Educational content only. Not financial advice. DYOR.

MoneyGram expands Solana access to connect crypto with global cash networks.
Stablecoins could push blockchain deeper into everyday payments.
Investors should watch real-world usage and value capture across Solana’s ecosystem.
MoneyGram is taking another step into blockchain-based payments, and this time the focus is Solana.
The global payments company has expanded its MoneyGram Ramps service to Solana, allowing wallets, exchanges and developers on the network to connect digital assets with local currencies through MoneyGram’s global cash network. The service supports cash deposits in more than 25 countries and withdrawals across more than 170 countries and territories.
But for investors, the bigger story is not simply another company adding Solana support. It is the growing connection between traditional payment infrastructure and blockchain networks.
From Crypto Trading To Real-World Payments
For years, much of crypto adoption revolved around trading and speculation. That is gradually changing as financial companies look for ways to use blockchain technology for actual money movement.
MoneyGram’s latest move is an example of that shift.
Its Ramps service essentially acts as a bridge between digital assets and physical money. Wallet users can move between crypto and local currencies without the entire payment process having to remain inside the blockchain ecosystem. MoneyGram handles settlement, compliance and the connection to its physical cash network.
If this model scales, blockchain could become less visible to consumers while becoming more important underneath the financial system.
Why Solana Matters
MoneyGram’s decision is particularly interesting because the company is not merely adding Solana as another supported network.
In June, MoneyGram became an active Solana validator and joined the Solana Developer Platform as an infrastructure partner. That means the company is participating at both the network and application levels.
For Solana, this provides another example of a traditional financial institution building directly around its blockchain infrastructure.
For investors, however, the important question is whether these institutional integrations eventually translate into sustained transaction activity and economic value across the ecosystem.
More tradition finance organizations are now moving towards crypto adoption. Source: create.vista.com / cryptosignals
The Stablecoin Connection
Stablecoins could be one of the biggest beneficiaries of this trend.
Unlike volatile cryptocurrencies, stablecoins are designed to maintain a relatively stable value, making them more suitable for payments, remittances and settlement.
MoneyGram has already spent years building infrastructure around stablecoins through its partnership with Stellar. It also partnered with Kraken earlier this year to provide crypto-to-cash withdrawals through its global network.
The Solana expansion therefore looks less like an isolated announcement and more like another piece of MoneyGram’s broader strategy to connect blockchain-based assets with traditional money.
What Investors Should Watch
The biggest opportunity may not be the headline itself, but what happens if these integrations begin generating significant real-world payment volume.
Investors should watch whether stablecoins increasingly move beyond crypto trading into remittances, cross-border payments, merchant transactions and business settlement.
They should also watch whether other payment companies follow the same path.
If more financial institutions begin connecting their existing networks to blockchains, competition could shift from which cryptocurrency wins to which blockchain becomes the preferred settlement infrastructure.
That distinction matters.
A blockchain can attract major institutional partnerships without those partnerships necessarily translating into immediate gains for its native token. The long-term value will depend on actual usage, transaction activity and how much economic value the network captures.
An X post is reporting the adoption of crypto by MoneyGram. Source: X / cryptosignals
The Bigger Picture
MoneyGram’s Solana expansion is another sign that the boundary between traditional finance and crypto is becoming less distinct.
The company is not abandoning its existing payment network for blockchain technology. Instead, it is using blockchain networks to extend what its existing infrastructure can do.
That could become the more important trend for investors to follow.
The next phase of crypto adoption may not be about replacing traditional finance. It may be about traditional financial companies quietly building blockchain into the infrastructure that moves money around the world.
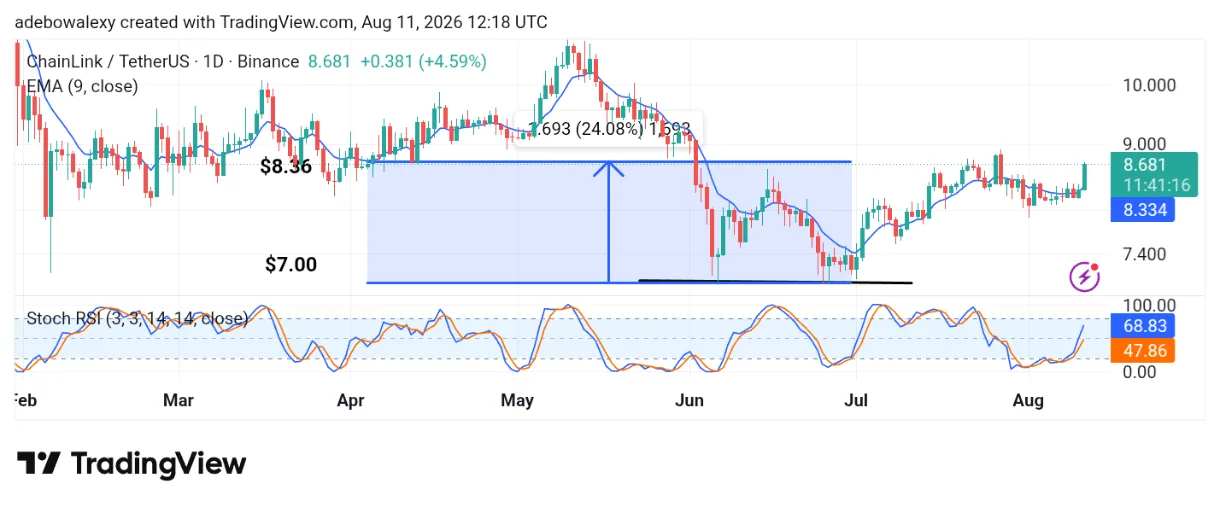
LINK is gaining bullish momentum, rising nearly 6% and trading above the 9-day EMA.
Technical indicators remain positive, with SRSI showing increasing buying pressure.
LINK could target $9–$12 short term, while a reported long-term $200 target remains highly speculative.
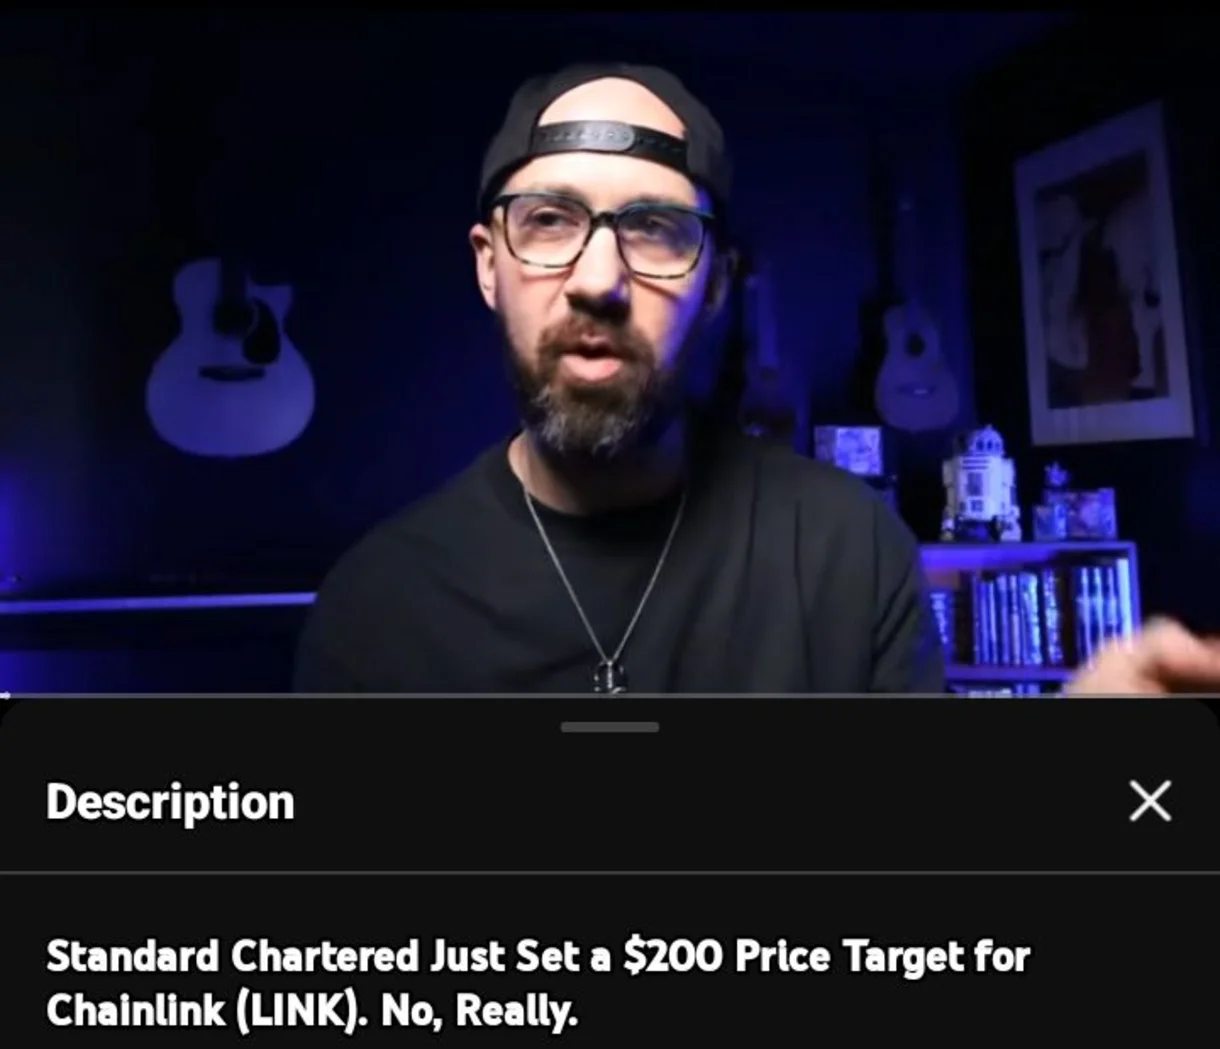
While the fundamentals surrounding Chainlink appear strong, price action has also responded positively. Standard Chartered has reportedly predicted that the price of LINK could eventually rise toward $200.
Chainlink 24-Hour Price Chart
Today’s trading in the LINK/USDT market has been significantly bullish, with the token gaining nearly 6%. This move has brought the market closer to the $9 level.
Chainlink (LINK) Sees a Surge in Price. Source: TradingView
Meanwhile, the Stochastic Relative Strength Index (SRSI) lines have responded positively, trending upward and indicating increasing buying momentum.
LINK Bullish Momentum May Be Strong
From a technical standpoint, the Chainlink market appears to have strong bullish momentum. The candlestick representing the current session supports this view, while price action remains above the 9-day EMA.
The SRSI lines are also moving higher toward the overbought region, suggesting that buying pressure remains strong. Combined with reports that Standard Chartered has projected a potential $200 price target for LINK, these developments could further strengthen bullish sentiment.
Chainlink (LINK) Sees a Surge in Price. Source: YouTube
Chainlink Eyes $9–$12 in the Short Term
Although LINK is currently trading at around $8, the available indicators suggest that further gains may be possible. Today’s strong performance reflects the positive sentiment surrounding the token.
While the projected $200 target represents a longer-term possibility, LINK could first target the $9 and $12 levels if the current bullish momentum continues.
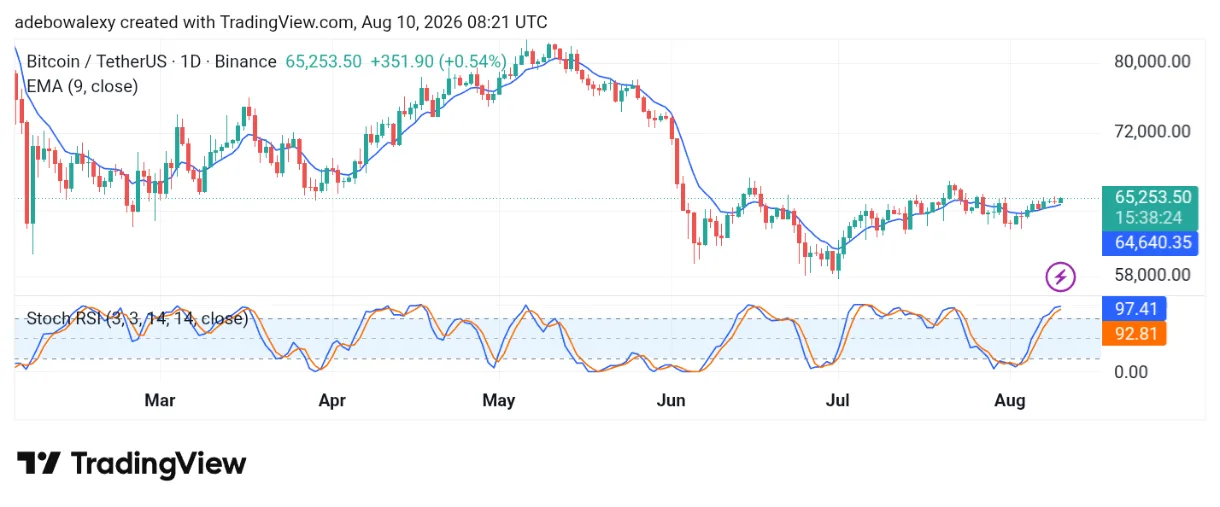
Bitcoin remains bullish, trading above $65,000 and the 9-day EMA.
Momentum is weakening, with SRSI in overbought territory.
Holding $65,000 is crucial for BTC to potentially target $70,000.
While Bitcoin’s institutional adoption continues to grow, its price has also been showing strength. As of the time of writing, the token is trading above the $65,000 mark. Technical indicators also suggest that bullish forces may continue to support higher prices.
Bitcoin 24-Hour Price Chart
Looking at the Bitcoin 24-hour chart, it is evident that price action is trading above the 9-day Exponential Moving Average (EMA). The latest price candle is also green, indicating continued buying activity.
Bitcoin (BTC) Sustains Above a Key Level. Source: TradingView
Meanwhile, the Stochastic Relative Strength Index (SRSI) lines have entered the overbought region. In fact, the lead line has reached the 100 level but continues to move sideways around that point.
BTC Bulls Seek a New Support
A closer examination of the chart shows that bullish momentum has weakened significantly. Over the past two sessions, the market has experienced a notable squeeze, suggesting reduced price volatility.
However, the ongoing session indicates that buyers are attempting to defend support above the $65,000 level. Although the SRSI remains deeply in the overbought region, its movement suggests that bullish momentum may be weakening.
Bitcoin (BTC) Sustains Above a Key Level. Source: YouTube
Holding Above $65,000 Could Be Crucial for BTC
The Bitcoin market is currently attempting to establish a base above the key psychological $65,000 level. However, the overbought condition could create short-term downward pressure, potentially causing the price to retest or even briefly breach this support.
Nevertheless, if buyers successfully defend the level, Bitcoin could regain momentum and continue its upward movement toward the $70,000 price level.
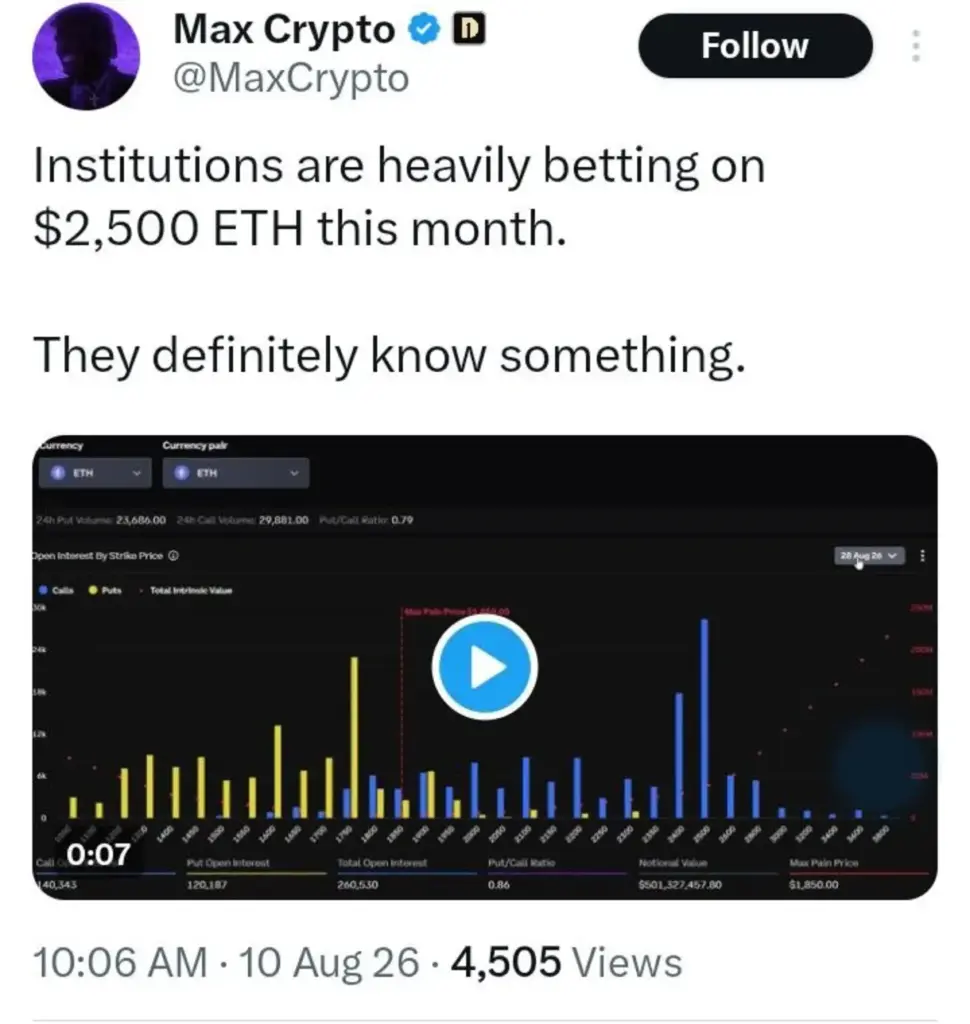
ETH options show strong call interest around $2,500.
Max pain sits at $1,850, adding caution to the bullish outlook.
ETH’s recent momentum could determine which level matters most.
Options positioning tells a different story than spot price ever can — it shows not just where a market is, but where large participants are willing to stake money on it going. Ethereum’s latest options data points to a specific level well above where ETH currently sits.
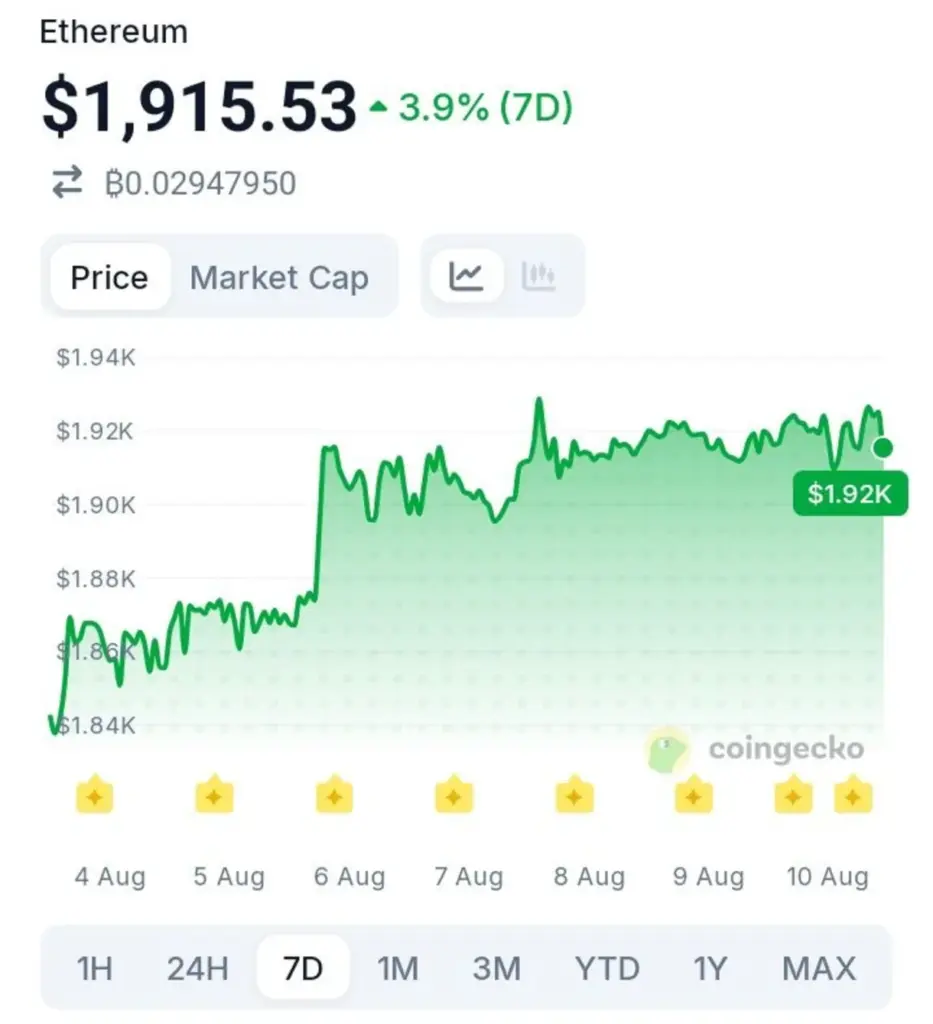
Max Crypto posted on August 10, 2026 that institutions are heavily betting on $2,500 ETH this month, pointing to options open interest data for the August 28, 2026 expiry on Deribit. ETH trades at $1,915.53, up 3.9% over the past seven days, according to CoinGecko.
Image Via X.
What the Options Data Actually Shows
The chart behind this claim tracks open interest by strike price for the August 28 expiry, showing a total of 260,530 contracts split between 120,187 puts and roughly 140,343 calls, carrying a notional value of $501.3 million. The put/call ratio sits at 0.86, indicating call positioning modestly outweighs puts across the full spread of strikes.
Within that data, a visible concentration of call open interest builds toward the $2,400 to $2,500 range — well above ETH’s current spot price — which is the specific cluster the post is highlighting as a bullish signal.
Why “Max Pain” Complicates the Bullish Read
Options open interest concentrated at a strike doesn’t necessarily mean traders expect price to land there. The same data set shows a max pain price of $1,850 for this expiry — the level at which the largest number of options would expire worthless, causing maximum financial pain to option holders as a group.
Max pain tends to sit closer to current spot price precisely because it reflects the strike where both bullish and bearish positioning roughly offset, whereas a strong call concentration at $2,500 more likely reflects traders buying cheap, longer-shot upside exposure rather than the market’s consensus price target.
The Chart Behind the Current Move
Looking at the seven-day chart, ETH climbed from around $1,840 on August 4 to a sharp jump above $1,900 by August 6, then continued grinding higher through the week, touching a high near $1,930 on August 9 before settling at $1,915.53. That steady uptrend gives some context for why call buyers might be targeting higher strikes — ETH has already closed roughly a third of the distance toward $2,500 in just the past week.
ETHUSD Chart. Source: CoinGecko.
Reading Options Positioning With the Right Caution
Heavy call open interest at a given strike reflects where traders have placed bets, not a guarantee of where price is heading — and $501 million in notional value, while meaningful, is a fraction of Ethereum’s overall derivatives market. Whether ETH’s current momentum carries it meaningfully closer to $2,500 before this expiry, or whether $1,850 proves the more accurate gravitational pull as August 28 approaches, is something only the next few weeks of price action will settle.
Hitachi is actively helping govern and build on Hedera.
Its role strengthens Hedera’s enterprise credibility.
Real-world adoption will be the key test going forward.
A blockchain network’s credibility with enterprises isn’t proven by press releases — it’s proven by who shows up to actually govern it. Hedera counts a Fortune 500 industrial giant among the companies doing exactly that, and the relationship has had time to mature into something more concrete than a headline.
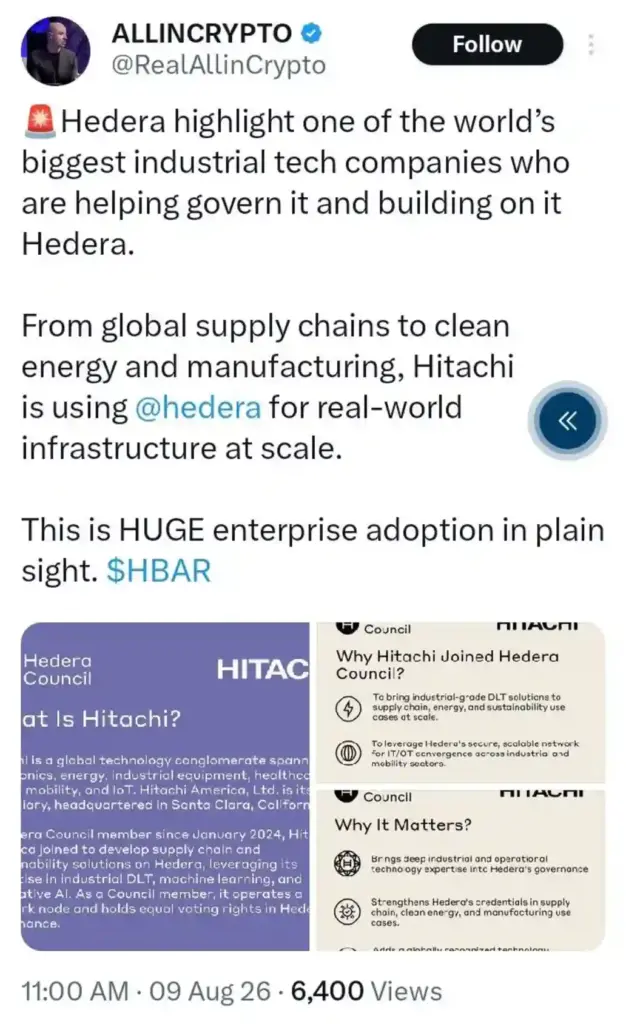
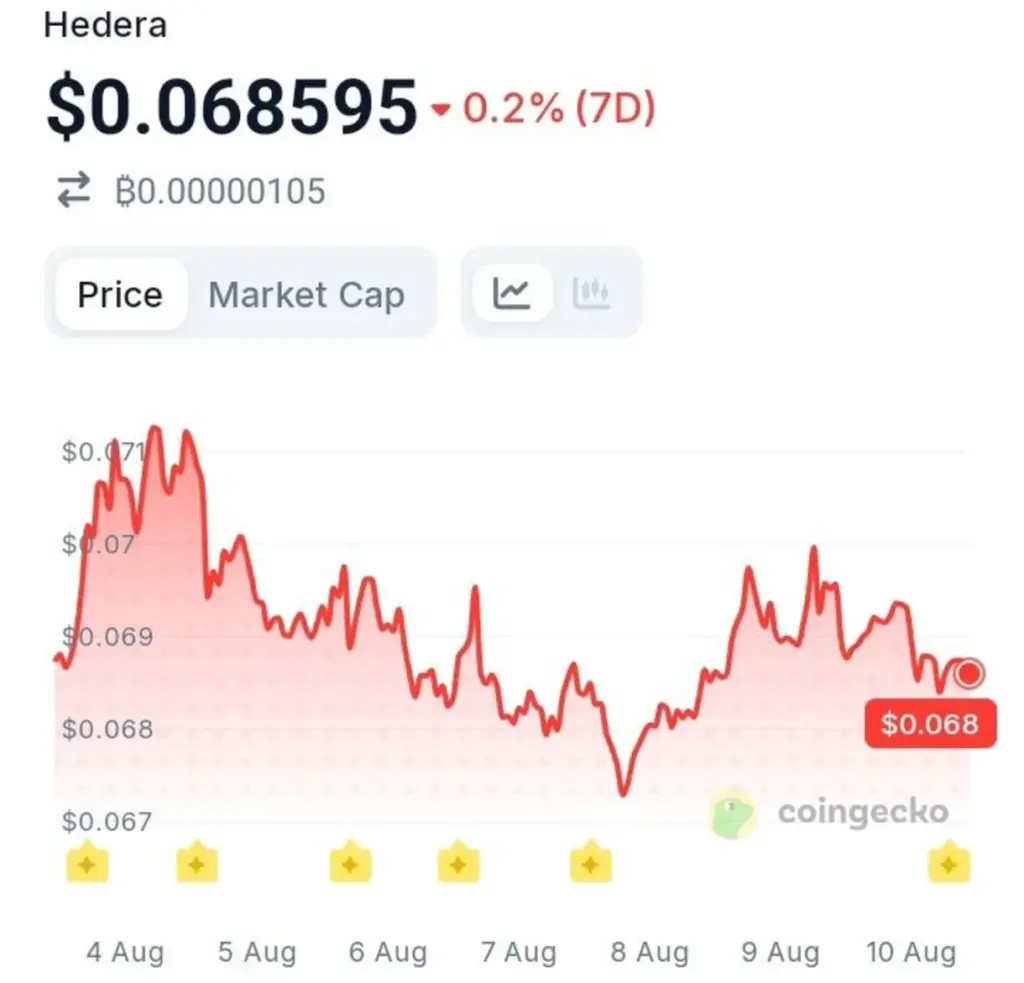
ALLINCRYPTO highlighted on August 9, 2026 that Hitachi is helping govern and build on Hedera, spanning use cases from global supply chains to clean energy and manufacturing. HBAR trades at $0.068595, down 0.2% over the past seven days, according toCoinGecko.
Image Via X.
Why Hitachi’s Role Carries Real Weight
Hitachi America joined the Hedera Governing Council specifically to bring industrial, supply chain, and clean energy expertise into the network’s governance process, helping shape how Hedera’s distributed ledger technology gets applied across IT, operational technology, and industrial use cases at scale.
Unlike a typical partnership announcement, Council membership means Hitachi holds an equal vote in decisions about Hedera’s software and services, and operates one of the network’s governing nodes — a structurally different level of commitment than simply building an application on top of the chain.
Part of a Council Built From Fortune 500 Names
Hitachi’s presence isn’t an isolated case — it sits alongside a governing body that includes Google, IBM, Boeing, Deutsche Telekom, DBS Bank, and Standard Bank, among roughly 30 other global enterprises sharing equal governance rights over the network.
That structure is central to Hedera’s pitch to institutions: rather than relying on anonymous validators, the network is run by a rotating council of large, identifiable organizations, each with direct commercial reasons to keep the infrastructure reliable for real-world deployment.
What the Chart Shows
Looking at the seven-day chart, HBAR spent the week drifting in a narrow band, sliding from around $0.070 on August 4 to a low near $0.067 by August 8, before a modest recovery brought price back to $0.068595. The muted price action reflects a market that hasn’t reacted sharply to renewed attention on Hitachi’s role — enterprise governance participation tends to be a slow-moving fundamental story rather than a short-term catalyst.
HBARUSD Chart. Source: CoinGecko.
Why Enterprise Governance Matters More Than Price Action
Council members like Hitachi aren’t just token holders — they’re expected to build real proof-of-concept work in areas like supply chain resiliency and sustainability tracking, the kind of infrastructure decisions that take years to fully materialize into visible network usage.
For a network competing to become the settlement layer of choice for large enterprises, having an industrial conglomerate the size of Hitachi actively shaping governance is a stronger signal of institutional trust than transaction volume alone. Whether that trust eventually converts into measurable on-chain activity from Hitachi’s own supply chain and energy initiatives is the next milestone worth tracking.
A crypto watchlist helps traders focus. Without one, it is easy to jump between random coins, chase social media hype, and enter poor setups. A good weekly watchlist narrows the market to coins with real reasons to pay attention.
Start with liquidity. Large-cap coins such as Bitcoin, Ethereum, Solana, XRP, and other high-volume assets are usually easier to trade than tiny tokens. Better liquidity means tighter spreads, cleaner execution, and less manipulation risk.
Next, check trend. Is the coin above or below major moving averages? Is it making higher highs or lower lows? A coin in a clean trend is usually easier to plan than one chopping sideways with no clear direction.
Then identify key levels. Mark obvious support, resistance, recent highs, recent lows, and high-volume areas. Your watchlist should not just say “watch SOL.” It should say what level matters and why.
Catalysts are important too. Upcoming upgrades, ETF news, token unlocks, legal decisions, exchange listings, or macro events can affect volatility. A coin with a catalyst and a clean chart deserves more attention than a random coin pumping for no reason.
Relative strength is another filter. If Bitcoin is flat but one large-cap altcoin is holding up well, that coin may be attracting stronger demand. If the market rallies and a coin fails to move, it may be weaker.
Keep the list short. Three to six coins is enough for most traders. A huge watchlist creates distraction. The goal is to be prepared, not overloaded.
Finally, define the plan before the week begins. For each coin, write: bullish above what level, bearish below what level, invalidation, and possible target zones. If price never reaches your area, do nothing.
Key takeaway:
A strong crypto watchlist is built from liquidity, trend, levels, catalysts, and relative strength. It keeps traders prepared instead of reactive.
Educational content only. Not financial advice. DYOR.
SOL is showing strong bullish momentum, trading above $75 and the 9-day EMA.
SRSI is rising, indicating increasing buying pressure.
SOL could target $80 short term, with $100 possible if momentum continues.
While the Solana blockchain continues to seek newer innovations on its network, its price has been tracking these developments. Talks about the Helius Ring are raising hopes of incorporating more privacy functions into the blockchain. As such, price action for the coin has also remained on track toward a psychological resistance level.
Solana 24-Hour Price Chart
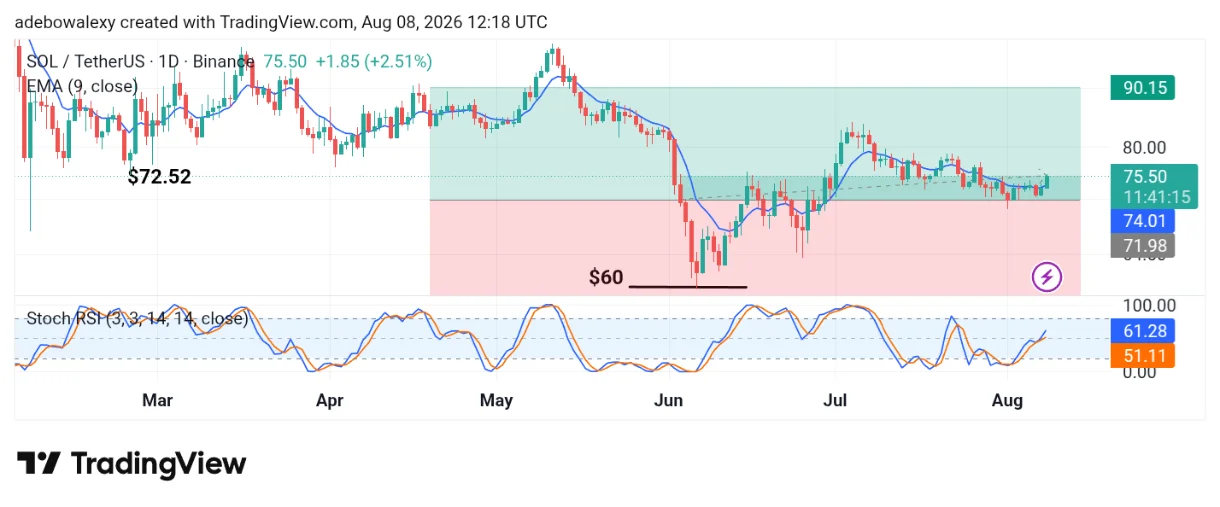
The ongoing session for the Solana token has been largely bullish. As can be seen, the latest price candle appears strongly green.
Solana (SOL) Stays on Track Toward the $80 Mark. Source: TradingView
Trading also remains above the 9-day Exponential Moving Average (EMA), with the token now trading above the $75 price level. The Stochastic Relative Strength Index (SRSI) indicator lines are pointing upward and moving toward the overbought region.
SOL Will Likely Maintain a Northward Path
The SRSI indicator appears to affirm that bullish forces have gained a strong foothold, supporting the possibility of continued upward movement.
The terminal part of the SRSI has reversed from a downward crossover and is now rising further. At this point, price action appears to be heading toward a short-term target at the $80 price level. However, this outlook remains subject to prevailing market sentiment.
Solana (SOL) Stays on Track Toward the $80 Mark. Source: X.com
Solana Locks In on $80 as a Nearby Target
Indications from the SOLUSDT market support bullish momentum. The ongoing session currently remains above a key technical level, the 9-day EMA.
At the same time, the SRSI indicator lines are moving upward toward the overbought region. Therefore, the $80 price level may be reached shortly, with the market potentially trending toward the $100 mark subsequently.
Ethics disputes rarely move crypto markets on their own. But when the sticking point involves a sitting president’s personal holdings and the bill everyone’s been waiting on for market structure clarity, the comments carry more weight than a typical political soundbite.
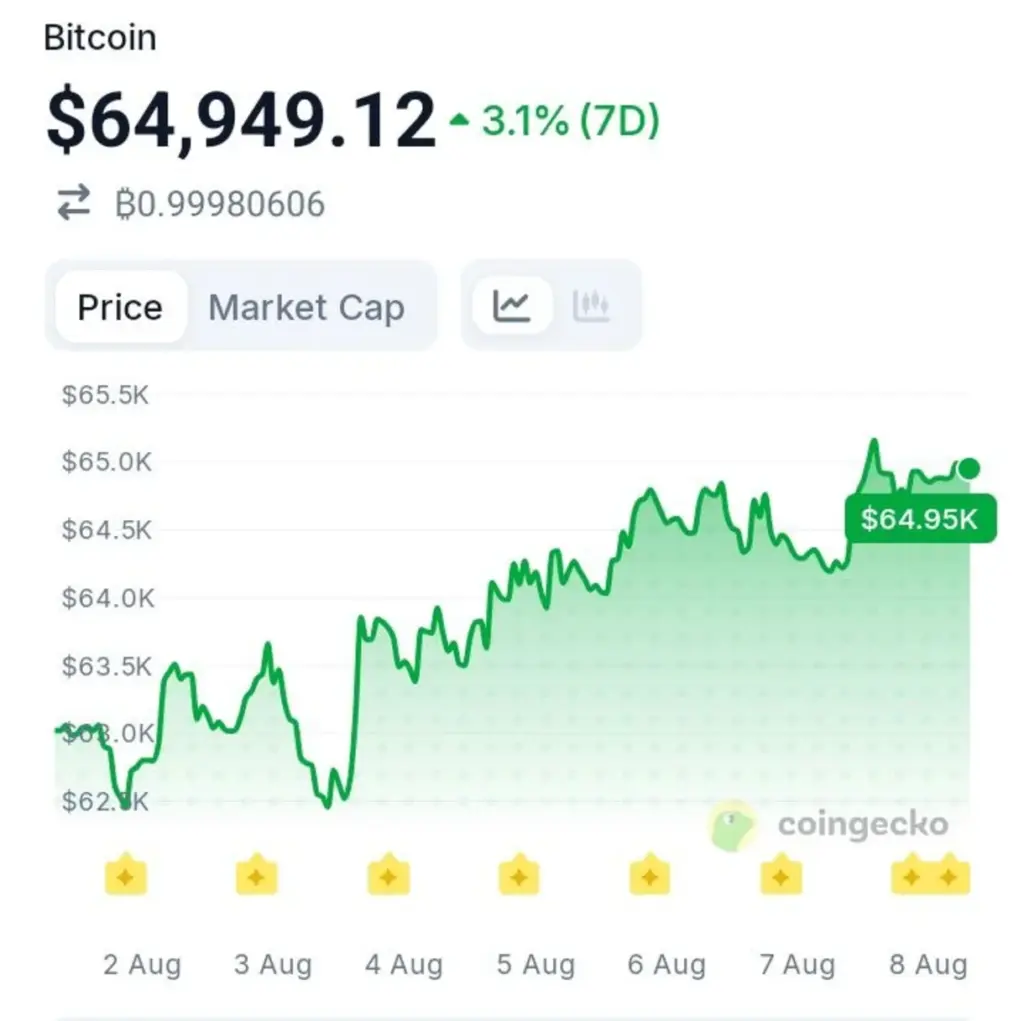
CoinMarketCap reported on August 7, 2026 that President Trump said he’d accept putting his crypto in a blind trust under the CLARITY Act, adding that his kids handle his holdings rather than him. Bitcoin trades at $64,949.12, up 3.1% over the past seven days.
Image Via X/CoinMarketCap.
Why This Comment Matters to the Bill’s Progress
The CLARITY Act has been stalled for months over a specific sticking point: ethics provisions that would restrict officials, including the president, from profiting off crypto businesses while in office. Trump has previously pushed back on rules he sees as unfairly targeting him and his family’s crypto ventures compared to other political figures.
His willingness to accept a blind trust arrangement represents a notable shift, potentially removing one of the more contentious obstacles that’s kept the bill from moving through the Senate.
The Chart Behind the Timing
Looking at the seven-day chart, Bitcoin climbed from a low near $62,500 on August 2 to a strong rally through the week, pushing past $64,500 by August 6 and holding near $64,949.12 as of August 8. That steady upward move happened alongside ongoing CLARITY Act negotiations, though isolating this single comment as a direct driver of the week’s gains would overstate its individual weight against broader market momentum.
BTCUSD Chart. Source: CoinGecko.
The Bigger Picture Still Unresolved
Even with this concession, the bill faces other unresolved fights — including a developer-liability shield that’s split law enforcement opinion and stablecoin-yield language drawing pushback from banking groups. Whether a blind trust offer is enough to unlock a Senate vote, or simply removes one obstacle among several, will determine if this becomes the moment CLARITY’s odds improve or just another headline in a legislative fight that’s dragged on for months.