Funding rates are an important part of crypto futures trading. They show which side of the market is paying to keep leveraged positions open.
Even if you do not trade futures, funding rates can help you understand market sentiment.
What Are Funding Rates?
In perpetual futures, there is no expiry date. Funding payments help keep the futures price close to the spot price.
When funding is positive, long traders usually pay short traders. When funding is negative, short traders usually pay long traders.
What Positive Funding Means
Positive funding often means more traders are aggressively long. This can show bullish sentiment, but it can also become crowded.
If funding gets extremely positive, the market may be vulnerable to a long squeeze. That happens when price drops and leveraged longs are forced to close.
Negative funding means shorts are paying longs. This can show bearish sentiment.
When funding becomes very negative, the market may be crowded short. If price starts rising, short traders may be forced to cover, creating a short squeeze.
Funding as a Sentiment Tool
Funding rates are not automatic buy or sell signals. They are context.
Moderately positive funding in an uptrend may be normal. Extremely positive funding after a huge rally may be a warning. Negative funding at major support may suggest too many traders are leaning bearish.
Why Beginners Should Be Careful
Futures trading adds leverage, liquidation risk and funding costs. A trade can be directionally correct but still painful if leverage is too high or funding costs build up.
Beginners should understand spot trading and risk management before touching leveraged futures.
Funding works best when combined with support, resistance, volume and trend.
For example, if price is at resistance, momentum is fading and funding is extremely positive, the market may be vulnerable. If price is at support and funding is very negative, a squeeze higher may be possible.
The Bottom Line
Crypto funding rates help traders understand positioning in perpetual futures.
Use them as a sentiment gauge, not a standalone signal. Crowded trades can unwind violently, especially when leverage is involved.
Need help applying this to live market conditions? Get instant access to our VIP trading signals here.
Ripple proposes institutional lending on the XRP Ledger.
The initiative could expand XRPL beyond cross-border payments.
Investors are watching its long-term adoption potential.
For years, the XRP Ledger has been known primarily as a network for fast and low-cost cross-border payments. But that narrative may be about to expand. Ripple has proposed a new lending protocol for the XRP Ledger that could allow banks and payment providers to borrow against tokenized assets without leaving the blockchain.
Although the proposal is yet to be approved and implemented, it reflects a growing trend in the crypto industry: blockchains are no longer competing only to move money faster—they are racing to become the financial infrastructure that powers lending, asset tokenization, and institutional finance.
Why This Matters
If approved, Ripple’s proposed XRPL Lending Protocol could transform the XRP Ledger from a payments-focused blockchain into a broader platform for institutional finance. Beyond enabling fast cross-border payments, the network could support on-chain lending backed by tokenized assets, creating new opportunities for banks, payment providers, and other regulated financial institutions.
The significance for investors goes beyond the lending feature itself. As the tokenization of real-world assets accelerates, demand is expected to grow for blockchain networks capable of supporting lending, borrowing, and settlement. By positioning the XRP Ledger to provide these services, Ripple is laying the foundation for greater institutional participation and expanding the network’s long-term utility.
A blockchain that combines payments, tokenization, decentralized trading, and institutional lending offers a more complete financial ecosystem, making it more attractive to developers, financial firms, and liquidity providers.
XRP is pushing towards being accepted by banks for cross-border payments. Source: Cryptosignals
Still, investors should keep expectations in check. The lending protocol is only a proposal and must receive community approval before it can be deployed on the XRP Ledger mainnet. Even then, adoption by financial institutions will likely be gradual as banks assess regulatory, compliance, and operational requirements.
For now, the proposal is best viewed as a long-term strategic move rather than a short-term price catalyst. If approved and widely adopted, it could increase activity on the XRP Ledger, strengthen its utility, and reinforce Ripple’s vision of building a comprehensive blockchain infrastructure for institutional finance.
Why Banks Could Find the Proposal Attractive
If approved, the XRPL Lending Protocol could give banks and payment providers compelling reasons to adopt the XRP Ledger. By allowing tokenized assets to be used as collateral, financial institutions could unlock liquidity without selling their holdings. The protocol could also automate collateral management, interest calculations, repayments, and settlements, helping reduce costs, paperwork, and settlement times.
More importantly, the proposal positions the XRP Ledger to support the growing market for tokenized real-world assets. As more financial assets move on-chain, banks will need reliable infrastructure for lending, settlement, and liquidity management—an opportunity Ripple hopes the XRP Ledger can serve.
For investors, the long-term potential lies in greater institutional adoption. If banks and payment providers embrace the protocol, it could boost activity on the XRP Ledger, attract more developers and enterprise users, and strengthen the network’s overall utility. While this does not guarantee higher XRP prices, increased institutional participation could reinforce confidence in the ecosystem and Ripple’s vision of building a comprehensive blockchain platform for institutional finance.
That said, the protocol remains a proposal. Its success will depend on community approval, regulatory clarity, security, and whether financial institutions see enough value to integrate it into their operations.
Looking Ahead: Should Investors Pay Attention?
Although the XRPL Lending Protocol is still awaiting approval, it signals Ripple’s ambition to expand the XRP Ledger beyond payments into institutional finance. As the blockchain industry shifts toward tokenizing real-world assets such as real estate, bonds, stocks, and commodities, Ripple is positioning the XRP Ledger to compete in this growing market.
If successful, the XRP Ledger could evolve into a platform where institutions issue tokenized assets, access on-chain liquidity, settle transactions, and manage financial operations within a single ecosystem. This could attract more banks, fintech firms, payment providers, and developers, strengthening the network over time.
For investors, the proposal is a development worth watching. While there is no guarantee it will be approved or widely adopted, it reinforces Ripple’s long-term vision and could strengthen confidence in the XRP Ledger’s future as institutional blockchain adoption continues to grow.
Final Thought
Rather than reacting to headlines, investors should watch key milestones, including community approval, mainnet deployment, institutional partnerships, and real-world adoption. For long-term investors, the proposal underscores Ripple’s ambition to expand the XRP Ledger’s role in global finance. As always, investment decisions should be guided by thorough research, risk tolerance, and a long-term perspective—not market hype.
ZEC remains in a long-term uptrend, supported by positive ecosystem developments.
Bullish momentum is improving despite price trading below the 9-day EMA.
A breakout could target the $500–$600 range over the long term.
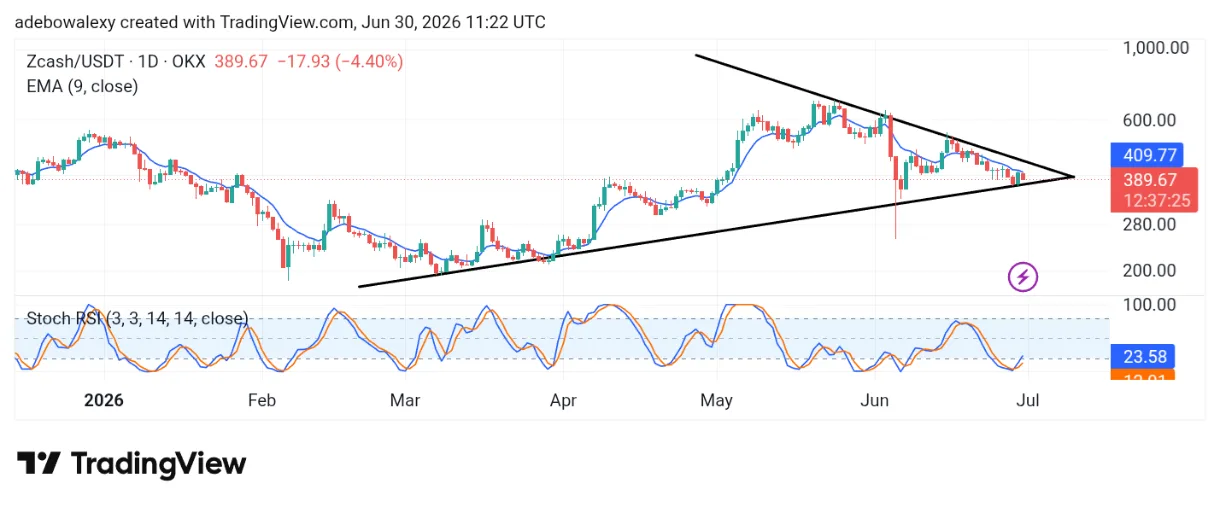
Zcash remains one of the better-performing cryptocurrencies today, with the token posting a gain of nearly 2.5%. In addition, ongoing developments within the Zcash ecosystem continue to strengthen its long-term outlook. These positive fundamentals could support further price appreciation in the coming sessions.
Examining the Zcash Market on the 24-Hour Chart
The daily chart shows that ZEC has maintained an upward trajectory since March. More recently, price action has formed a symmetrical triangle pattern, which typically signals that a breakout—either upward or downward—may be approaching.
A bearish candle represents the current session, with the price trading below the 9-day Exponential Moving Average (EMA). Despite these developments, the Stochastic Relative Strength Index (SRSI) is rising from the oversold region, indicating that bullish momentum may be starting to build.
The Market Implications of ZEC’s Price Movement
The broader trend remains bullish despite the current short-term weakness. Although ZEC is still trading below the 9-day EMA and today’s candle is bearish, the upward trajectory of the SRSI suggests that buying momentum is gradually improving.
However, because the SRSI remains close to the oversold region, traders may want to exercise caution until stronger bullish confirmation emerges.
Zcash Still Has Upside Potential
The long-term structure of the ZEC market has remained positive since March, even though recent price action has formed a symmetrical triangle. While the token continues to trade below the 9-day EMA, the improving SRSI momentum suggests that buyers may soon regain control.
Combined with the positive developments surrounding the Zcash ecosystem, the market could be positioned for another leg higher. As a result, traders may consider the $500- $600 price range as a potential long-term upside target.
Disclaimer:
Note: Cryptosignals.org is not a financial advisor. Do your research before investing your funds in any financial asset, product, or event. We are not responsible for your results.
One of the most fascinating aspects of the financial markets is that they are completely unbiased. The market does not care about your status, education, or reputation. At the same time, it does not reward laziness or indiscipline. Many aspiring traders are attracted by “get-rich-quick” schemes that promise wealth with just 15 minutes of effort each day. Unfortunately, many only realize they’ve fallen into a trap after discovering that consistent profitability requires far more dedication.
Anyone serious about trading should consider reading Jack Schwager’s classic book, Market Wizards. The book features interviews with some of the world’s most successful traders, exploring their strategies, mindsets, and experiences. One lesson stands out throughout the book: trading is not an easy pursuit. It demands hard work, continuous learning, patience, and resilience—qualities that no shortcut can replace.
The Truth About Trading. Source / Cryptosignals : Pixabey
Trading Success Requires Real Effort
Achieving consistent success in trading doesn’t happen overnight. Like any highly skilled profession, it requires education, countless hours of practice, discipline, and a commitment to continuous improvement. Nearly every successful trader has a story of early losses, costly mistakes, and difficult lessons that ultimately shaped their success.
Trading is a profession built on discipline and continuous development. One thing I’ve consistently observed when discussing trading is that many people lose enthusiasm the moment they realize how much work is involved. Too often, people are drawn by the promise of quick profits, only to discover that lasting success comes through persistence, calculated risk-taking, and the willingness to learn from setbacks. Those who accept this reality are the ones most likely to succeed.
The Truth About Trading. Source / Cryptosignals : Pixabey
Accepting the Process
For those willing to put in the work, the rewards of trading extend far beyond financial gains. The journey develops discipline, resilience, emotional control, and a deeper understanding of risk and decision-making.
Although the path to becoming a successful trader is demanding, those who remain committed to learning, stay patient, and persevere through challenges often find the experience deeply rewarding.
Ultimately, the financial markets do not reward shortcuts or complacency. They reward discipline, preparation, consistency, and continuous improvement.
Disclaimer:
Note: Cryptosignals.org is not a financial advisor. Do your research before investing your funds in any financial asset, product, or event. We are not responsible for your results.
Trading less can often lead to better long-term profits.
Low-quality trades quietly drain both capital and confidence.
Discipline and patience help traders avoid costly mistakes.
Many traders believe that the more trades they place, the more money they will make. It seems logical—the more opportunities you take, the greater your chances of profiting. But in reality, some of the most successful traders earn more by trading less.
Their edge doesn’t come from constant activity but from waiting patiently for the highest-quality setups.
Why Account Blow Up
Many traders assume that a blown account is the result of one disastrous trade or an unexpected market crash. While those events can happen, they are rarely the real culprit. More often, trading accounts are drained by a series of small, avoidable mistakes—entering low-quality setups, breaking trading rules, risking too much on a position, or chasing the market out of fear of missing out.
Individually, these mistakes may seem insignificant, but over time they steadily erode both your capital and your confidence until recovering becomes increasingly difficult.
Series of price actions on the monitor screen. Source: create.vista.com / cryptosignals
The Silent Account Killer: Low-Quality Trades
Not every losing trade is a bad one—even perfect setups fail. However, many losses are completely avoidable “suboptimal trades” entered without meeting your strategy’s strict criteria. While a single undisciplined trade seems harmless, repeatedly forcing these low-edge setups quietly drains your capital and erodes your confidence.
Over time, this emotional and financial erosion creates a damaging cycle far worse than a single large, standard loss.
Why Traders Break Their Own Rules
Why do traders ignore their own rules? It usually comes down to three psychological traps: FOMO, which forces hasty entries out of fear of missing a market move; overconfidence, where a winning streak causes a trader to relax their criteria; and justifying “almost perfect” setups, accepting four out of five conditions when their strategy demands all five.
Every exception weakens the system and exposes the trader to unnecessary risk. Professional traders understand that rules are not suggestions—they are the foundation of long-term profitability.
Why Less Trading Often Produces Better Results
Beginners often equate more trades with more profit, but success actually relies on quality over quantity. Professional traders patiently wait for high-probability setups that fully meet their criteria, naturally reducing trade volume while maximizing win rates and risk-to-reward opportunities.
This selective approach preserves capital for the best setups and fosters emotional stability. By trading less, traders avoid the stress and impulsive revenge trading that constant exposure brings, allowing them to remain objective, disciplined, and focused on strategy over emotion.
Trade Like a Professional
Professional trading isn’t about finding more trades—it’s about consistently filtering out the wrong ones. Instead of hunting for reasons to enter the market, pros focus on eliminating poor opportunities using three key habits:
Deploy a Pre-Trade Checklist: Verify that every single condition in your trading plan is met before entering a position. If even one requirement is missing, walk away.
Avoid Obvious Obstacles: Skip trades facing immediate barriers, like strong overhead resistance. Waiting for “clean” setups with room to run ensures the profit potential actually justifies the risk.
Review Your Rejections: Analyze the trades you chose not to take. Reviewing discarded setups reinforces discipline, validates your patience, and sharpens your ability to distinguish high-quality opportunities from mediocre ones.
Conclusion
A major trading misconception is that success requires constant activity. In reality, profitable traders know every trade carries risk, so they only commit capital when the odds are heavily in their favor.
The market always generates new opportunities; missing a single trade rarely damages an account, but forcing a setup that violates your strategy will. Patience isn’t hesitation—it is discipline. By prioritizing quality over quantity, executing rules without compromise, and waiting for high-probability setups, you protect your capital and secure consistent, long-term success.
Note:
Cryptosignals.org is not a financial advisor. Do your research before investing your funds in any financial asset, product, or event. We are not responsible for your results.
Traders must take full responsibility for their results.
The biggest enemy is often their own mistakes and emotions.
Discipline drives long-term success.
Hello. Recently, I watched a real interview of Elon Musk from 2007. That interview gave me an insight into how he thinks, his beliefs, and his core values.
I’m writing this article because there are direct parallels between his way of thinking and trading. There are lessons, points, and nuggets that we can take from his mindset and apply to the markets.
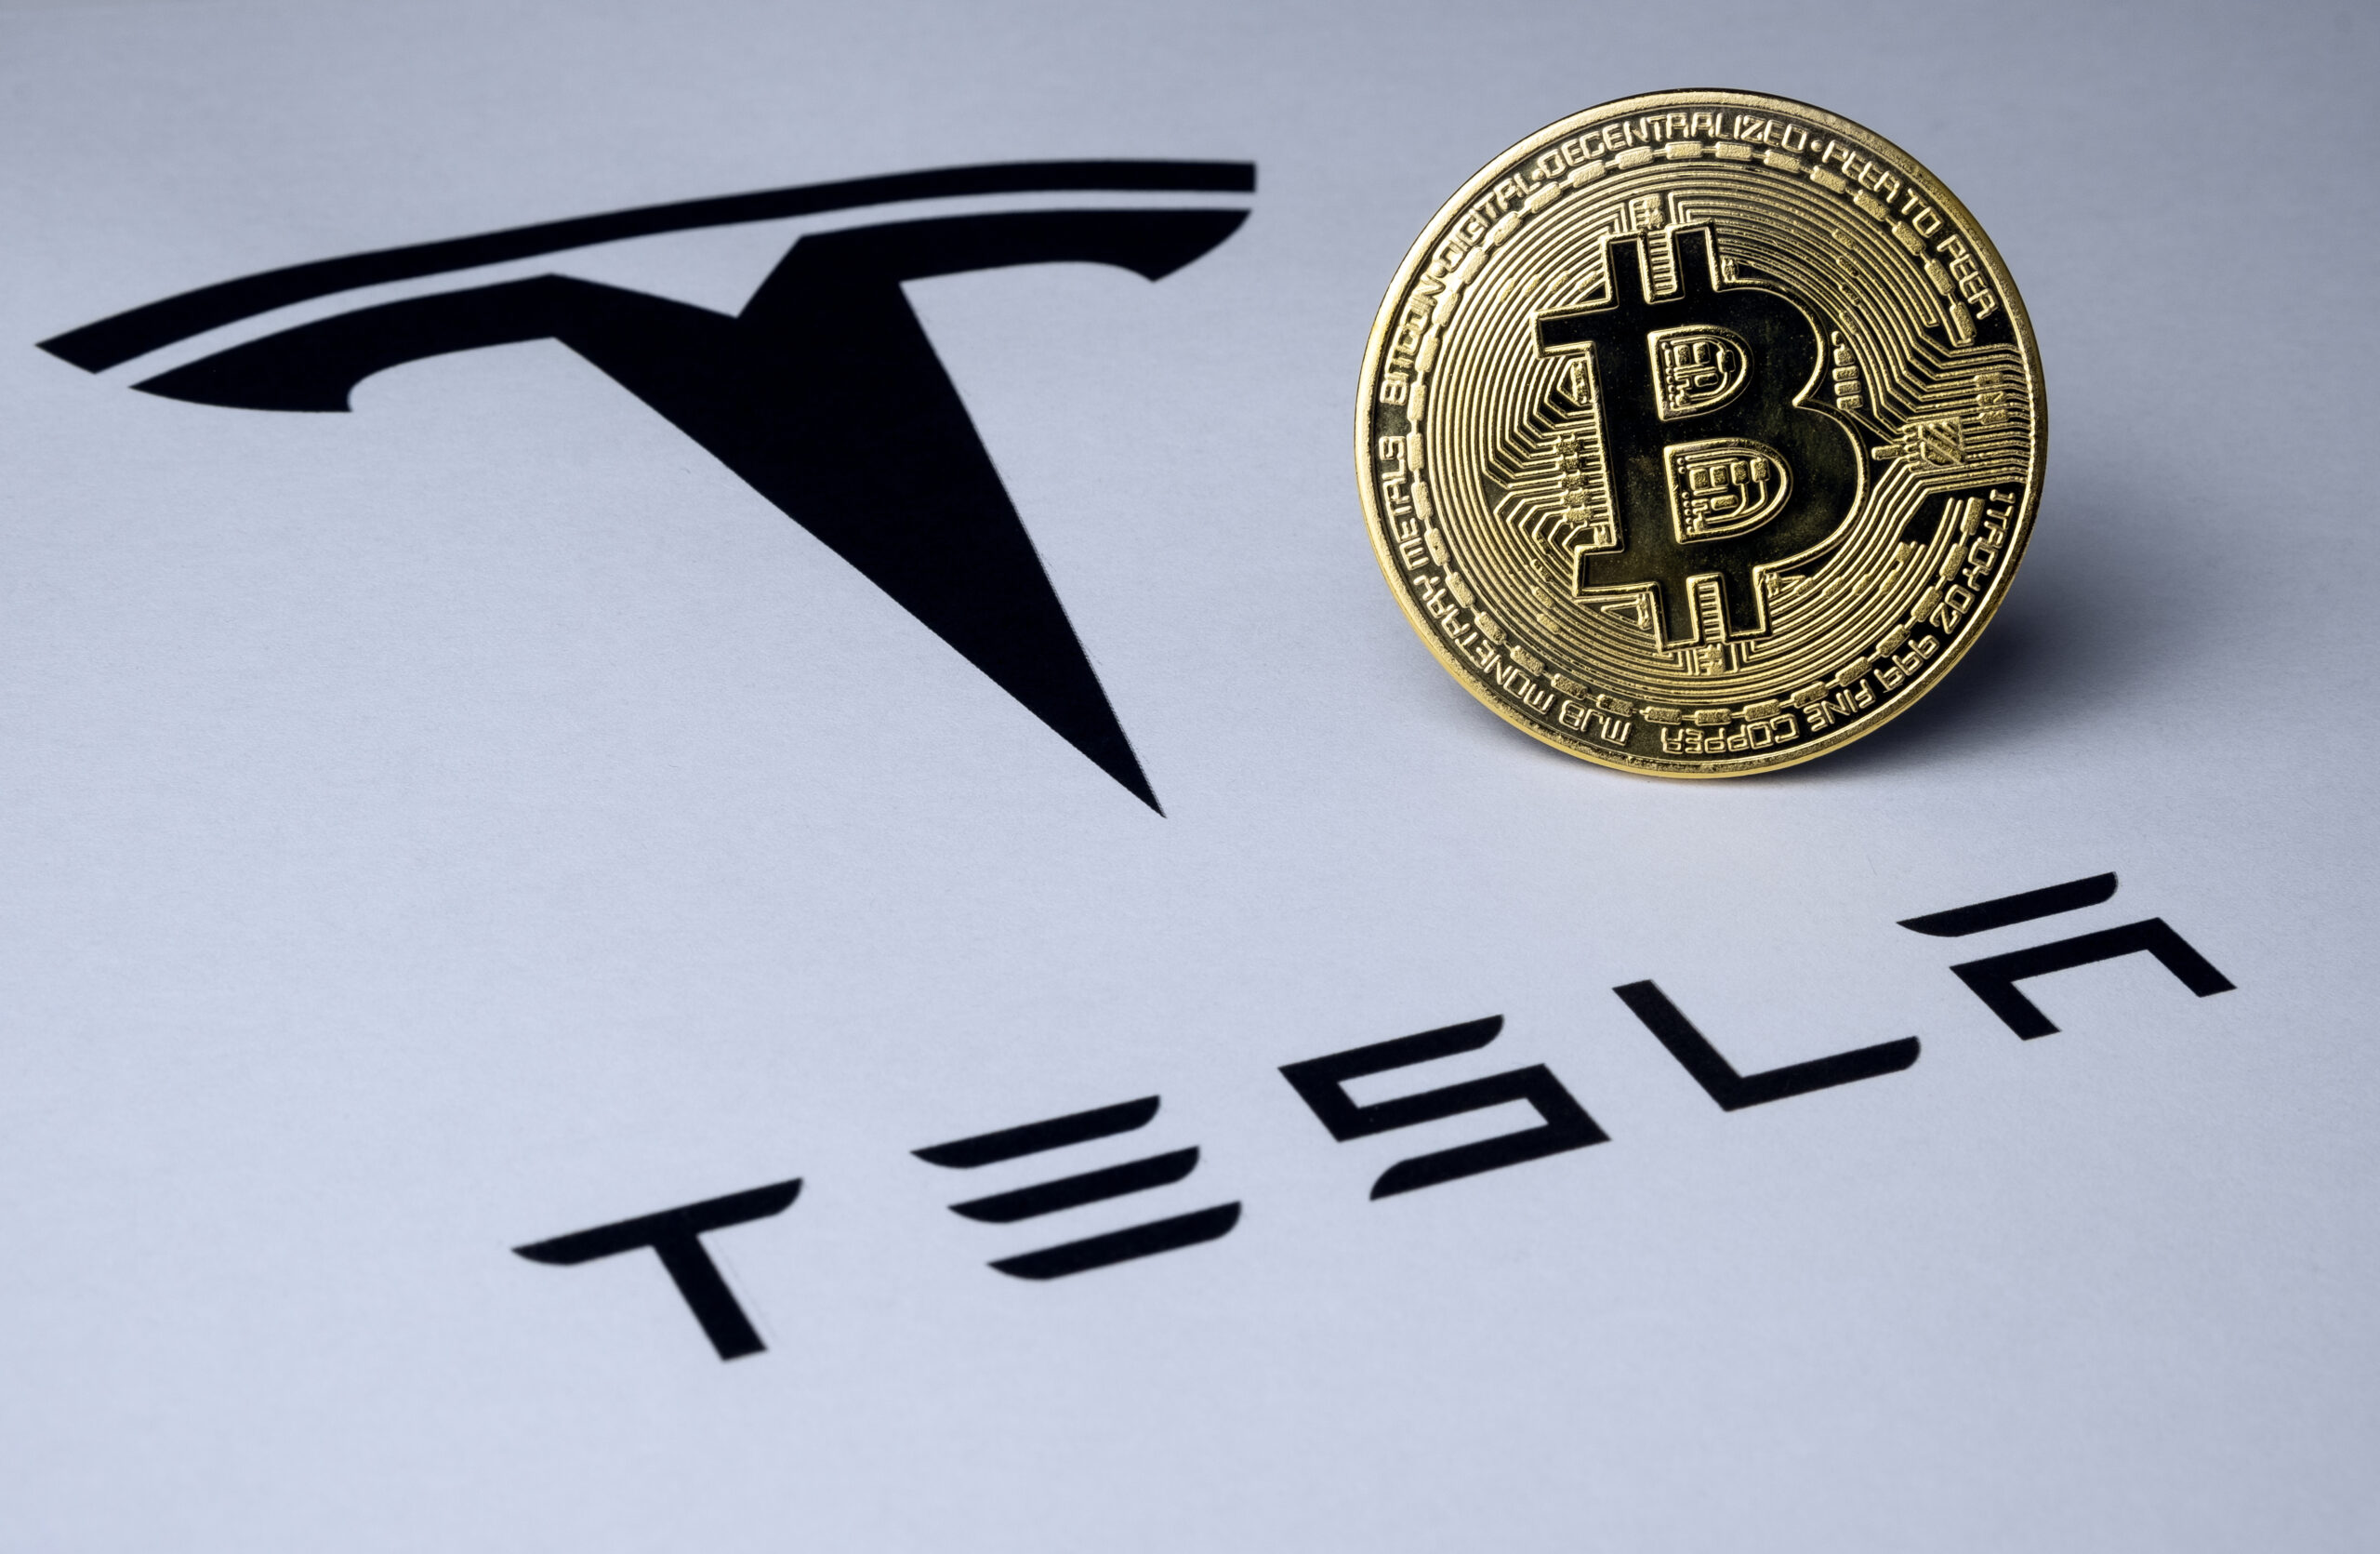
In 2007, he was already the CEO of Tesla. Although he wasn’t the original founder, he joined the company as a major investor and shareholder, became the chairman of the board, and later took over as CEO. I watched this interview with intent and was able to gather about four or five lessons that can be applied to trading.
Tesla logo beside BTC. Source: Pixabay.
In those days, he was not yet a billionaire—he was a multimillionaire worth hundreds of millions of dollars. He didn’t actually become a billionaire until 2012.
Lesson 1: You Are Your Own Worst Enemy
During an interview back when Elon Musk was the chairman of SpaceX, he was asked about his competitors. At the time, SpaceX was facing competition from major players: Jeff Bezos’ Blue Origin, Richard Branson’s Virgin Galactic, the European Space Agency (ESA), and competitors in Japan.
When asked about them, Musk explained that he didn’t care about the competition. He did not view these companies as enemies or saboteurs. Instead, he acknowledged a fundamental truth: if SpaceX failed, it would be due to their own internal errors, carelessness, or mistakes—not because of outside forces.
What This Means for Traders
Traders must adopt this exact same mindset. In the market, you do not have external enemies. The market is not your enemy. Your broker or exchange is not your enemy. The trader on the other side of your trade is not your enemy.
You are your own enemy.
If a trade goes wrong or your account suffers, it is typically the result of your own incompetence, a lack of discipline, flawed psychology, or careless mistakes. True accountability means realizing that your trading success or failure is entirely in your own hands.
Slippage happens when your trade executes at a different price from the one you expected.
For example, you may try to buy at $1.00, but the order fills at $1.03 because there were not enough sellers at $1.00. That 3% difference is slippage.
In fast crypto markets, slippage can happen quickly.
Why Liquidity Matters
Low liquidity increases trading risk. Stops may fill worse than expected. Take profit orders may not execute cleanly. Spreads between bid and ask can be wide.
This is especially common in small-cap tokens, new launches and coins traded on smaller exchanges.
How to Check Liquidity
Look at trading volume, order book depth and spread. A coin with high daily volume and tight spreads is usually easier to trade.
Also check where the volume is happening. If most of the volume is on one obscure exchange, the practical liquidity may not be as good as it looks.
LINK is showing early signs of a bullish recovery.
A breakout above the 9-day EMA could drive price toward $8.00.
Strong fundamentals support a longer-term target around $11.00.
Chainlink’s growing adoption continues to strengthen its long-term outlook. With increasing blockchain integration in major global initiatives, the LINK market has the potential to witness significant price appreciation. At the same time, technical indicators suggest that a bullish breakout may already be underway.
Chainlink Market on the 24-Hour Price Chart
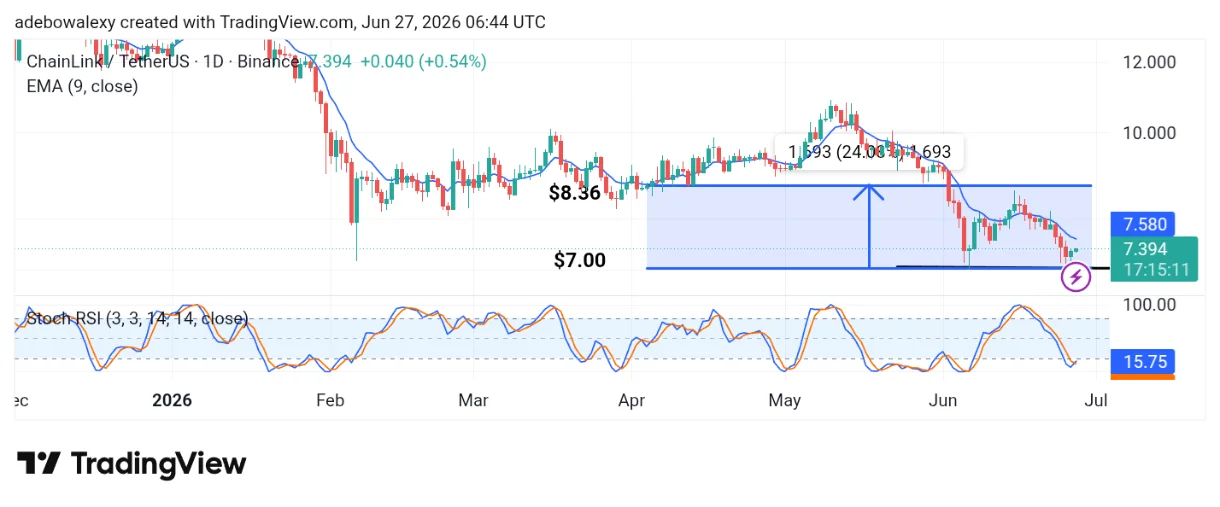
Price action in the LINK/USDT market has formed a “W” (double-bottom) pattern, a bullish reversal formation. Since the previous session, the market has rebounded upward, and the current session has maintained that momentum. However, the token continues to trade below the 9-day Exponential Moving Average (EMA), which remains a key resistance level.
Chainlink (LINK) Positions for Price Growth. Source / Cryptosignals: TradingView
Meanwhile, the Stochastic Relative Strength Index (SRSI) has produced a bullish crossover deep within the oversold region, indicating that buying momentum is beginning to build.
Chainlink’s Latest Move Appears to Be in Its Early Stages
The recent behavior of price action suggests that LINK may be at the beginning of a bullish recovery. A “W” pattern has formed near the important support level at $7.00, signaling that buyers are attempting to regain control of the market.
Chainlink (LINK) Positions for Price Growth. Source / Cryptosignals: YouTube
Although price action remains below the 9-day EMA, which limits short-term bullish confirmation, the recent bullish crossover on the SRSI suggests that momentum is gradually improving. This indicates that a stronger upward move could develop in the near term.
Chainlink Has the Potential to Break Above $8.00
Both technical and fundamental factors continue to support a bullish outlook for Chainlink. The emerging breakout pattern, combined with growing adoption of the Chainlink blockchain and ecosystem, provides a solid foundation for further price appreciation.
As a result, the $8.00 level appears to be within reach. If bullish momentum continues to strengthen, the market could extend its rally toward the $11.00 region over the longer term.
Disclaimer:
Note: Cryptosignals.org is not a financial advisor. Do your research before investing your funds in any financial asset, product, or event. We are not responsible for your results.
If there were a primary mechanical task that traders undertake to be profitable, it would be seeking an edge. They study indicators, optimise position sizing, experiment with entries, and spend endless hours refining their systems. Yet one of the most powerful upgrades costs nothing.
It is a belief.
We are not talking about mindless motivational slogans or nonsense such as The Secret or trying to get the universe to manifest profitability for you.
Psychologist Albert Bandura’s work on self-efficacy showed that an individual’s belief in their ability to perform is one of the strongest predictors of eventual success. Across education, athletics, business and countless other domains, the findings have been consistent. People who believe they can perform generally outperform those who doubt themselves.
Most forms of self-improvement involve effort—it has some form of cost.
Fitness requires training.
Education requires study.
Diet requires discipline.
Trading systems require testing.
Belief, however, has almost no entry cost.
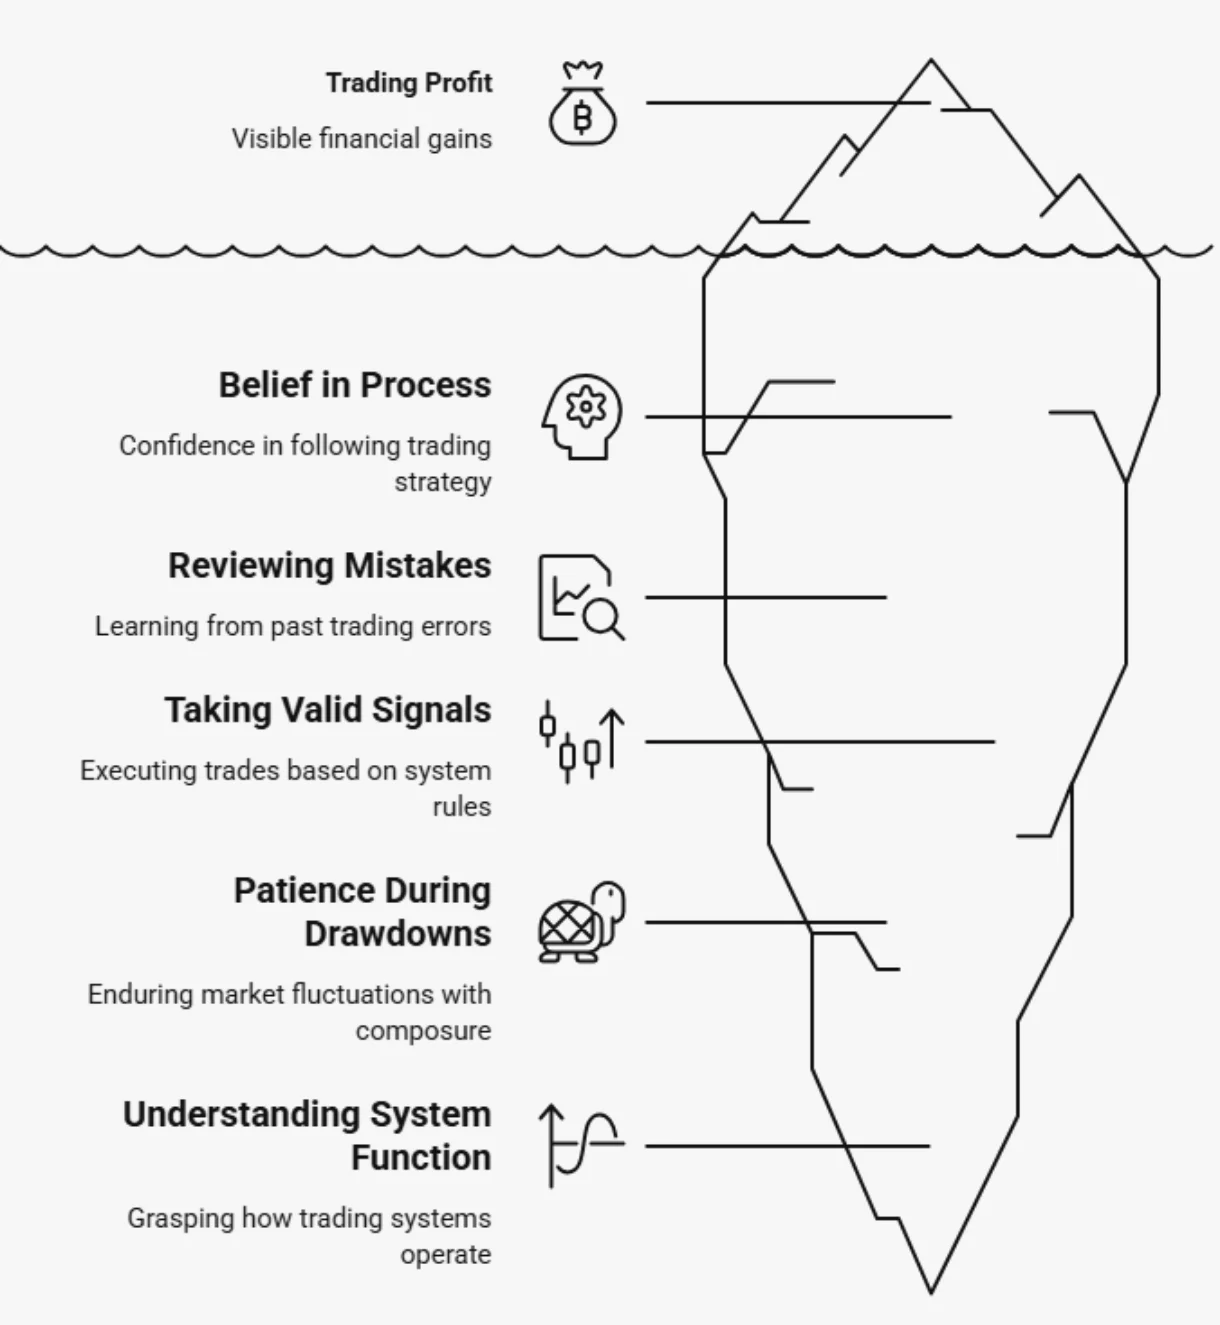
A trader who believes they can follow their process approaches markets differently from one who constantly doubts themselves. They review mistakes rather than abandon systems. They continue taking valid signals after losing streaks. They remain patient during inevitable drawdowns and maintain enough confidence to capture the occasional outlier that often determines long-term returns.
The trader who lacks belief frequently sabotages themselves before probabilities have time to work. To some degree, this is understandable as most misunderstand how trading systems function. New traders automatically assume they will be profitable from their very first trade. They don’t understand that trading systems take their losses first – this inevitably pushes the account into a drawdown. Winning positions take time to unfold.
Belief Changes Behaviour
Confidence is not merely a pleasant feeling. Belief influences action. Everything we think alters our software, which in turn influences our behaviour.
If you believe you are capable of becoming a successful trader, you are more likely to:
will unconsciously act in ways that confirm those assumptions.
They hesitate, overtrade, abandon systems, chase news, and interrupt the very process that might have worked if given sufficient time.
Their beliefs also become self-fulfilling.
Evidence Builds Confidence
It is important not to confuse belief with fantasy. People who drone on endlessly about manifesting things are locked into a fantasy. This is simply another version of wishful thinking.
Every time you enter a trade in your journal, you are collecting evidence that bolsters your belief system. The same is true each time you hold through a downturn without abandoning your system—you have anchored to the process.
Much of trading is simply being consistent, showing up each day and following your system.
If I were to break it down into a very simple flow, it would be Belief – Action – Results – StrongerBelief. Eventually, belief alters behaviour and behaviour alters outcome.

 Most Popular