Sui (SUIUSD) Consolidates Below Near-Term Resistance as Post-Rally Momentum Fades

SUI Price Prediction — January 15

SUI (SUIUSDT) is trading around the $1.770 region after failing to sustain momentum above the recent $1.810 range high. Following the sharp rebound that lifted price off recent lows, the market has transitioned into a sideways structure. Volatility has compressed and directional conviction has weakened, suggesting SUI is currently in a digestion phase where neither buyers nor sellers are exerting clear control.

SUIUSDT Market Key Levels

Resistance levels: $1.810, $3.100
Support levels: $1.770, $1.300

BYBIT:SUIUSDT Chart Image by Gaint-writer
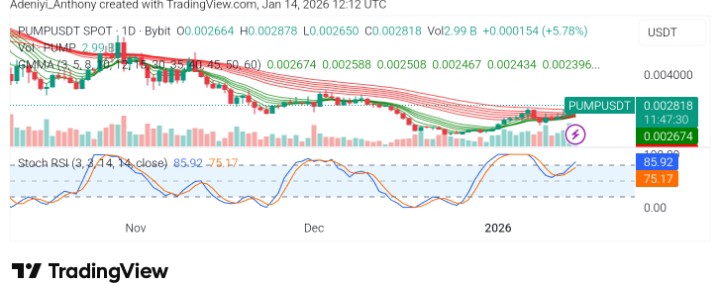
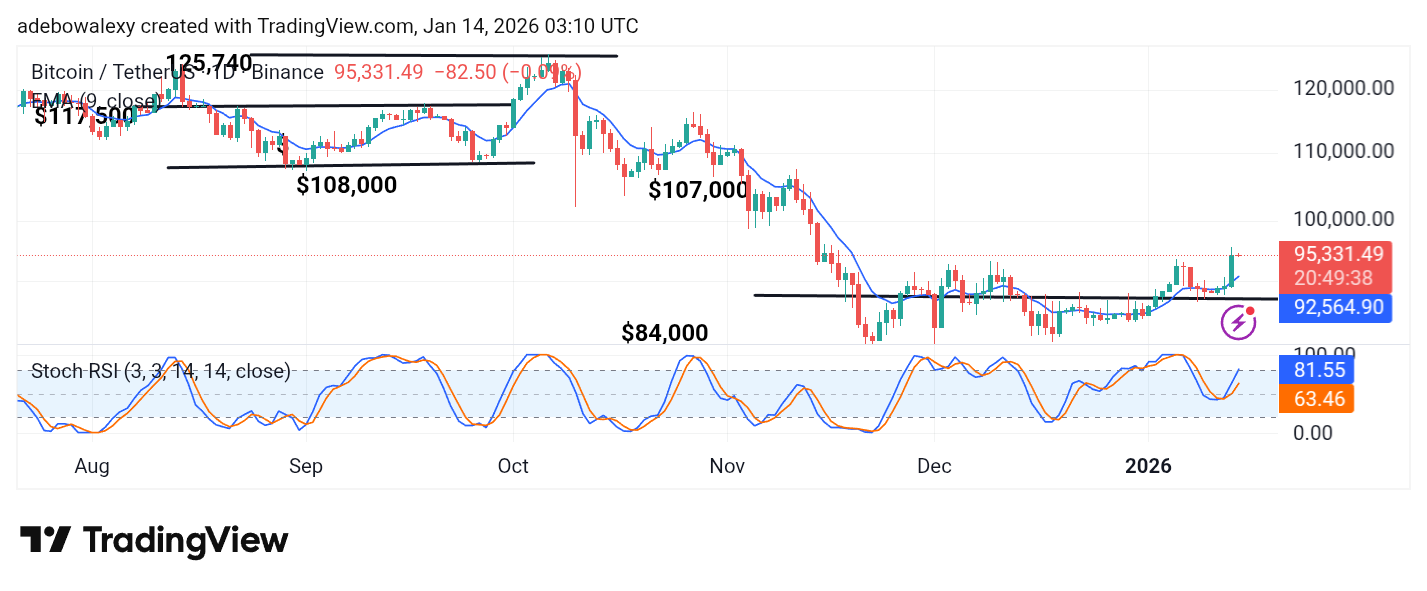
SUIUSDT MarketSUIUSDT Long-Term Trend — Neutral (Daily Chart)

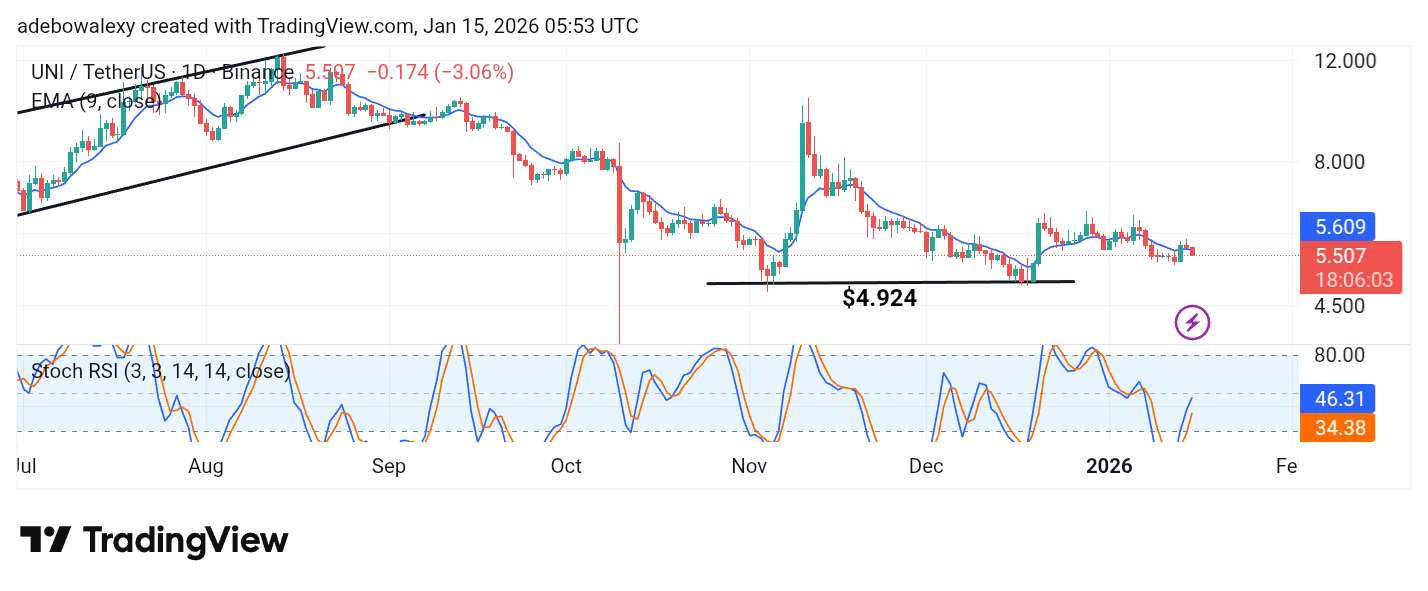
On the daily chart, SUI is showing signs of stabilization rather than full trend continuation. The broader structure still reflects recovery from a prolonged downtrend, but the recent push into the $1.810 zone lacked sustained follow-through. Price has since pulled back modestly and is now holding above the $1.770 support area.

What is the market outlook for SUIUSDT?

This behavior suggests that downside pressure has eased compared to prior months, yet buyers remain cautious at higher levels. The market appears to be reassessing value after the rebound, with price settling into a balanced zone rather than expanding aggressively.

Trend strength has improved from deeply bearish conditions, but confirmation remains limited. As long as SUI holds above the $1.77 support, the recovery structure stays intact. However, continued rejection below $1.81 keeps the daily bias tilted toward consolidation.

A clean breakout and acceptance above $1.810 would signal renewed upside strength and open the path toward the higher resistance near $3.100. Such a move would suggest that the current base is complete and that bullish continuation is possible, aligning with improving crypto signals across the broader market.

BYBIT:SUIUSDT Chart Image by Gaint-writer
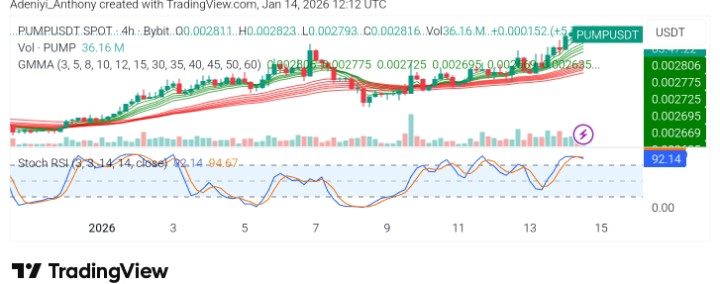
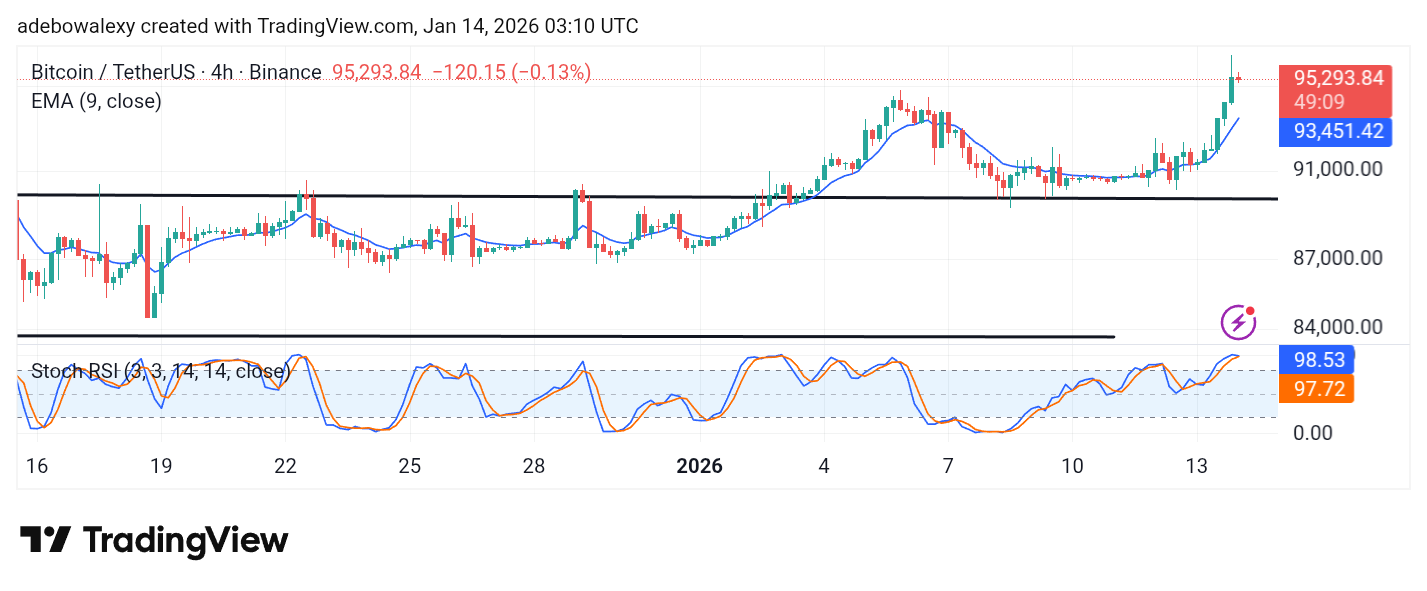
SUIUSDT Short-Term Trend — Neutral (4-Hour Chart)

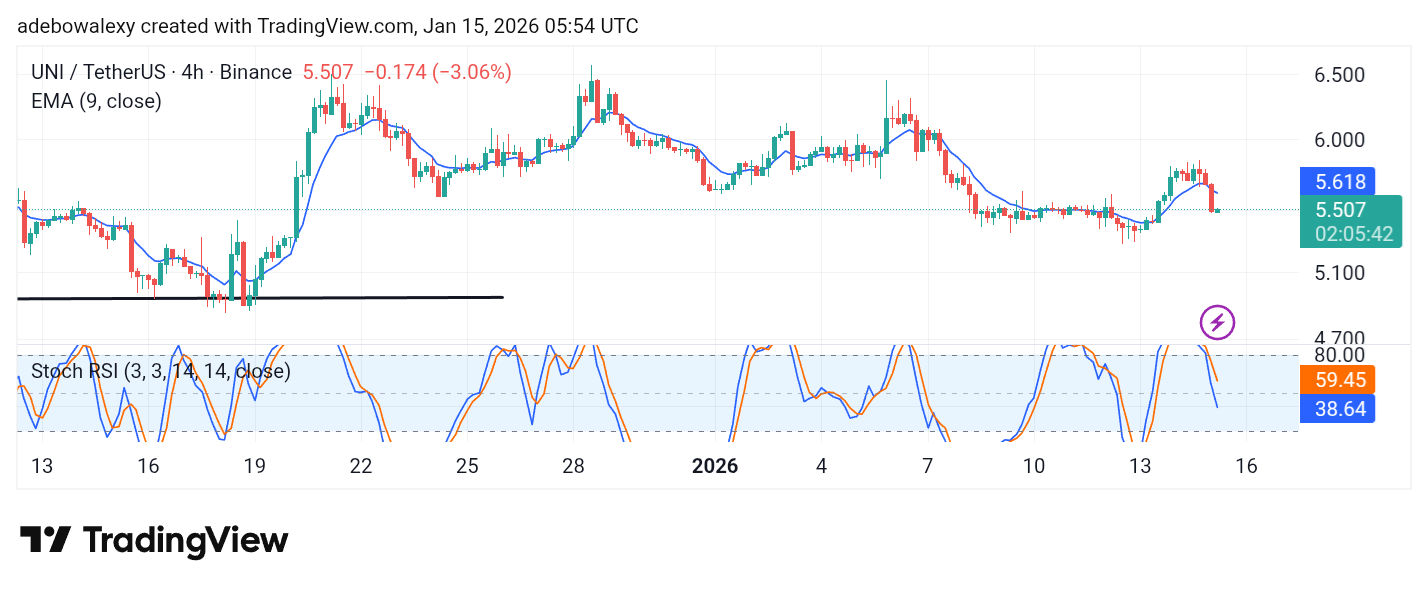
On the 4-hour chart, SUI continues to trade in a tight, compressed range. Price is rotating around the $1.770 to $1.810 mid-zone with shallow swings and limited momentum, reflecting reduced volatility compared to the prior rally leg.

This type of structure often precedes expansion. Nevertheless, until price decisively breaks above $1.810, short-term conditions favor patience rather than directional conviction.

SUIUSDT Market Statistics
Current Price: $1.770
Market Capitalization: $1.05B
24H Trading Volume: $320.00M

Place winning SUI trades with us. Get SUI here

CMC20 Index (DFTUSD) Consolidates Below Range High as Momentum Stalls Mid-Zone

CMC20 Price Prediction — January 15

CMC20 is currently trading around the $192.00 region after failing to sustain momentum above the upper range. Following the late-year recovery impulse, price has settled into a sideways structure, with volatility compressing and directional conviction fading. Current behavior suggests the index is in a digestion phase, with neither buyers nor sellers showing strong control.

CMC20 Market Key Levels

Resistance levels: $203.00, $227.00
Support levels: $176.00, $97.00

CMC20 Index (DFTUSD) Consolidates Below Range High as Momentum Stalls Mid-ZoneCMC20 Long-Term Trend — Neutral (Daily Chart)

On the daily chart, CMC20 remains in a recovery structure rather than an active trend expansion. The sharp downside shock from late November was absorbed quickly, followed by a rebound and stabilization above the $176.00 support zone. Since then, price action has transitioned into a controlled range, reflecting balance rather than dominance.

What is the Market Outlook for DTF?

Trend strength has improved from extreme bearish conditions, but follow-through remains limited. The index continues to hold above major support, which keeps the broader recovery thesis intact, yet the lack of sustained upside pressure shows that buyers are still cautious.

As long as CMC20 remains below the $203.00 resistance, the daily structure favors consolidation rather than continuation. A clean breakout and acceptance above $203.00 would signal renewed strength across the broader crypto market, opening the path toward the $227.00 resistance. Such a move would suggest that the recovery phase is transitioning into trend continuation, aligning with improving crypto signals across major assets.

CMC20 Index (DFTUSD) Consolidates Below Range High as Momentum Stalls Mid-ZoneCMC20 Short-Term Trend — Neutral (4-Hour Chart)

On the 4-hour chart, CMC20 continues to trade in a tight, compressed range. Price is rotating around the mid-zone with shallow swings and limited follow-through, reflecting reduced volatility compared to the prior impulse. This type of structure often precedes expansion, but until price decisively breaks above $203.00 key zone.

CMC20 Market Statistics
Current Price: $192.00
Market Capitalization: $520.00B
24H Trading Volume: $38.00B


You can purchase DTF here: BUY DTF


Uniswap (UNI) Price Prediction: UNI/USDT Stays Suppressed

Date: January 15, 2026

Since the start of the year, the Uniswap market has been hovering just above the $5.00 price level with little direction. This has continued to fuel bearish sentiment among traders and may keep the market limited in terms of potential gains.

UNI/USDT Long-Term Trend — Bearish (Daily Chart)

Key Price Levels

Resistance: $6.00, $7.00, $8.00

Support: $5.50, $5.00, $4.50

Uniswap (UNI) Price Prediction: UNI/USDT Stays Suppressed

The last two price candles on the Uniswap daily chart are red. The most recent candle is larger than the previous one, pushing the market further below the 9-day Exponential Moving Average (EMA) line. Meanwhile, the Stochastic Relative Strength Index (SRSI) lines remain tilted upward despite the losses recorded over the past two sessions.

Uniswap Price Prediction: UNI May Descend to the $5.00 Threshold

The latest trajectory presented on the Uniswap daily chart suggests that bearish pressure may be building. As downside momentum strengthens, price action could continue to move lower.

The most recent price candle places the market below the 9-day EMA curve. Although the SRSI lines are still pointing upward, this appears to be a lagging reaction, as price action has already turned downward. Consequently, lower price levels may be reached.

Uniswap Price Prediction: UNI/USDT Remains in Pursuit of Lower Price Levels (4-Hour Chart)

The Uniswap market continues to trend toward lower price levels on the 4-hour chart. The previous session was particularly significant for bears, as reflected by the size of its price candle.

Uniswap (UNI) Price Prediction: UNI/USDT Stays Suppressed

The latest candle is green but shows only minimal upward movement, keeping the coin trading below the 9-day EMA curve. Additionally, the SRSI lines are descending sharply into the oversold region. As a result, the market may continue toward the $5.25 price level.

Get Uniswap (UNI) here. Buy UNI 

Trezor Safe 7: Preparing Self-Custody for a Post-Quantum Future

As quantum computing continues to evolve, concerns about the long-term security of today’s cryptographic systems are steadily moving from theory to serious discussion. While quantum machines are not yet capable of breaking modern encryption, the crypto industry faces an important question: are we preparing early enough?

Trezor believes the answer must be yes—and the Trezor Safe 7 represents a decisive first step in that direction.

What Does “Quantum-Ready” Really Mean?

Trezor Safe 7 is not marketed as “quantum-proof,” and that distinction matters. Full protection against quantum threats will ultimately require upgrades at the blockchain level. However, the Safe 7 is designed so that the hardware itself will not become obsolete when those upgrades arrive.

In simple terms, being quantum-ready means the device is built to support future post-quantum cryptographic standards once they are adopted. Its internal architecture can securely verify and install quantum-resistant firmware updates, ensuring that users can transition safely as the broader ecosystem evolves.

Why Hardware Wallets Must Evolve

Across the tech world, major players like Apple, Google, Microsoft, and global financial institutions are already migrating toward post-quantum security models. Hardware wallets cannot afford to lag behind. If self-custody tools fail to evolve, they risk becoming the weakest link in digital asset security.

Trezor Safe 7 addresses this risk by shipping with hardware capable of handling cryptographic upgrades well into the future. Even if today’s encryption methods are eventually outpaced by quantum advancements, the device remains trustworthy through secure firmware verification.

Is the Quantum Threat Immediate?

No—but preparation cannot wait until the threat is fully realized. Upgrading global infrastructure takes years, not months. By the time quantum computing becomes a real danger to cryptographic systems, it will be too late to start redesigning hardware from scratch.

Trezor Safe 7 positions users ahead of that curve. When quantum-ready firmware becomes available, Safe 7 owners will already have the necessary foundation in place.

Trezor Safe 7: Preparing Self-Custody for a Post-Quantum Future

Leading the Transition in Self-Custody

By introducing the world’s first quantum-ready hardware wallet architecture, Trezor is setting a new benchmark for the self-custody industry. This move reinforces a long-standing principle: individuals should be able to hold their own keys without compromising on long-term security.

That said, the post-quantum transition is not something one company—or one product—can solve alone. It will require coordination across developers, blockchain networks, and security researchers.

Looking Ahead

Quantum computing will test every digital security system we rely on today. Trezor Safe 7 demonstrates that self-custody does not have to be left behind in that transition. By planning early and building adaptable hardware, the crypto ecosystem can ensure that financial sovereignty remains protected—even in a post-quantum world.

Trade crypto coins on BYBIT

Axie Infinity (AXS/USD) Bulls Capture $1.13 and Hold Above It

A bullish recovery in the Axie Infinity market is now confirmed, signaling the potential start of a sustained rebound. In the previous daily session, the $1.13 level served both as the session high and a key resistance. However, price action has since broken above this barrier, gaining upward momentum. With bulls maintaining control above $1.13, attention is now shifting toward the next upside target at $1.40.

Axie Infinity (AXS/USD) Market Data

  • AXS/USD Price Now: $1.30
  • AXS/USD Market Capitalization: $220 million
  • AXS/USD Circulating Supply: 178 million AXS
  • AXS/USD Total Supply: 270 million AXS
  • AXS/USD CoinMarketCap Ranking: #159

Key Levels to Monitor

  • Resistance: $1.40, $1.50, $1.60
  • Support: $1.13, $1.11, $1.00

A bullish recovery in the Axie Infinity market is now confirmed, signaling the potential start of a sustained rebound.

Axie Infinity Market Analysis: Technical Viewpoint

Between last year and this year, the Axie Infinity market consolidated around the $0.80 price level. Prior to this phase, a prolonged bearish trend had driven prices down sharply from levels near $10. This decline did not occur over a short period; rather, it reflected an extended bearish run that persisted throughout most of 2025.

Price is now approaching a critical crossroads at the $1.00 level. This zone has attracted renewed bullish interest; however, selling pressure remained strong, forcing bulls to establish support below $1.00—specifically around the $0.80 level. Today’s ongoing breakout may indicate an early shift in market sentiment in favor of the bulls. That said, it is important to recognize that bears have dominated this market for an extended period, and as a result, several overhead price levels may emerge as formidable resistance zones.

A bullish recovery in the Axie Infinity market is now confirmed, signaling the potential start of a sustained rebound.

AXS/USD 4-Hour Chart Outlook

In recent trading sessions, strong buying pressure has caused market volatility to spike, making current conditions less ideal for initiating new long positions. The Relative Strength Index (RSI) is signaling a strong overbought condition, while resistance has emerged around the $1.35 level. In addition, the Bollinger Bands are expanding sharply, reflecting heightened volatility. Given these signals, traders may need to exercise patience and wait for more favorable market conditions.

Axie Infinity promises a year of great expectation.

Trade crypto coins on BYBIT

Pump.fun (PUMPUSDT) Breaks Short-Term Bearish Structure as Buyers Reclaim Control

Over the last 24 hours, Pump.fun against Tether has recorded a strong 12.52% gain. This shows the pair is performing better than the broader crypto market, which saw a gain of 3.86% in the same period. As it stands, this gain follows the rising pattern of Bitcoin ($95k), as other altcoins witnessed a move to the north.

Many analysts are optimistic, as a large capital of $148 million in stablecoin to the Kraken exchange draws attention, with speculation rising that the funds could be linked to future investments in the interest of the token.

Currently, Pump.fun trades at $0.002818 with over 2.99 billion traded volumes.

Pump.fun (PUMPUSDT) Breaks Short-Term Bearish Structure as Buyers Reclaim Control
PUMPUSDT-Daily Chart

Technical Indicators

Major Resistance Levels: $0.00295, $0.00320, and $0.00380

Major Support Levels: $0.00267, $0.00243, and $0.00230

Technical Analysis

On the daily timeframe, Pump.fun against Tether seems to be showing early signs of a trend transition after an extended downtrend. However, the Guppy Multiple Moving Averages remain downward-sloping, suggesting the broader trend is still cautious.

From another angle, the Stochastic RSI on the daily is deep in overbought territory. Though this reflects strong momentum, it also warns about pullbacks before continuation. Structurally, if the pair can maintain a hold above $0.002670, recovery will be intact; a loss of that level would signal a false breakout.

Pump.fun Update

The pump.fun chart appears to be showing fresh momentum after posting a significant rise over the last 24 hours.

Meanwhile, from a technical perspective, it appears that the token will be turning the resistance point into a support floor soon, showing how continued upside moves can increase buying confidence.

To this end, one may say speculative rotation in stalled assets is one of the factors behind today’s gain. If Pump receives such a capital flow of this kind from now on, a break above major price ceilings may be seen later.

PUMP/USDT Analysis: Building Higher-High Structure

On the 4-hour chart, PUMP/USDT appears to be trending cleanly above the GMMA with the averages fanning upward. This shows the bulls are technically in control. As it stands, the market structure is showing higher highs and higher lows, confirming trend strength on the intraday timeframe. Additionally, the volume expansion on bullish candles suggests active participation rather than weak relief buying. Meanwhile, the stochastic overbought condition suggests a slight pullback may occur.

To this end, as long as the price continues to hold above $0.002720, the impending dip is actually corrective, not bearish. Therefore, a clean move above $0.002880 would trigger a big move on the larger timeframe.

Pump.fun (PUMPUSDT) Breaks Short-Term Bearish Structure as Buyers Reclaim Control
PUMPUSDT-4H Chart


You can purchase crypto coins here. Buy Crypto

Polkadot (DOT/USDT) Attempting a Base Formation as Sellers Lost Momentum Near Multi-Month Lows

The market for Polkadot against Tether has seen a 9.51% increase in the previous 24 hours. This rise indicates that the pair is performing better than the crypto market’s 3.86% gains, as the pair’s monthly trend shows a 14% gain. However, despite the recent positive move, the pair seems to be recovering from a recent decline. Meanwhile, current actions show renewed interest as altcoin investors become more willing to invest.

As it stands, analysts are of the opinion that the spot trading for Polkadot on the Robinhood platform is the major reason for the upward drive, as everyday trading becomes easier for investors.

Currently, Polkadot trades at $2.264 with more than 2.87 million traded volumes today.

Polkadot (DOT/USDT) Attempting a Base Formation as Sellers Lost Momentum Near Multi-Month Lows
DOTUSDT-Daily Chart

Technical Indicators

Major Resistance Levels: $2.500, $3.230, and $4.000

Major Support Levels: $2.190, $2.040, and $1.950

Technical Analysis

After what seems to be printing of lower highs and prolonged downside, Polkadot against Tether on the daily timeframe has been observed to be showing weakened bearish momentum as the price appears to be stabilizing above the $2.190 support level. As it stands, the volume indicator suggests aggressive distribution has eased with the short-term moving averages converging.

From another angle, the Stochastic RSI was reported to be recovering from mid-range levels, though this shows bullish intent, but trend reversal has not been confirmed. To this end, a sustained daily close above $2.50 would be required to invalidate the broader bearish bias and signal a potential trend transition toward the $3.20 resistance zone. Meanwhile, until that occurs, the pair might remain in a consolidation-within-downtrend phase.

Polkadot’s Update

The Polkadot chart is obviously not bullish, but the price appears to have reacted to another Fibonacci support level. This marks a favie-wave move up as the price heads towards a structural resistance around $2.39. However, the token has failed to hold above critical higher lows in the past; the current move may act similarly. To this end, a bullish trend on the short term will unfold only if the coming pullback is a corrective one.

DOT/USDT Analysis: Overbought, What’s Next?

On the 4-hour timeframe, DOT/USDT appears to be consolidating after a break above the cluster of the moving average ribbons. This seems to be complementing the daily consolidation narrative. However, the price action was observed to be controlled by the bears momentarily as candles turned red.

On the other hand, the Stochastic RSI on the 4h chart seems to be operating in the overbought region with bent lines, suggesting a potential pullback might be on the way. To this end, if the $2.040 line is not maintained, current gains may be erased.

Polkadot (DOT/USDT) Attempting a Base Formation as Sellers Lost Momentum Near Multi-Month Lows
DOTUSDT-4H Chart


You can purchase crypto coins here. Buy Crypto

Bitcoin (BTC) Price Prediction: BTC/USDT Trades Above the $90,000 Baseline

Date: January 14, 2026

The Bitcoin market has finally breached the closely watched resistance near the $95,000 level. The previous session was particularly strong, as reflected by a decisive bullish candlestick. Let’s examine how price action may unfold from here.

BTC/USDT Long-Term Trend—Bullish (Daily Chart)

Key Price Levels

Resistance: $97,500, $100,000, $102,000

Support: $95,000, $92,500, $90,000

Bitcoin (BTC) Price Prediction: BTC/USDT Trades Above the $90,000 Baseline

Although the current session is still in its early stages, BTC’s price action remains steady despite mild bearish pressure reflected by the most recent candlestick. The latest candle is a small red one, yet the price continues to trade comfortably above the 9-day Exponential Moving Average (EMA). Meanwhile, the Stochastic Relative Strength Index (SRSI) maintains an upward trajectory, reinforcing the prevailing bullish momentum.

Bitcoin Price Prediction: BTC/USDT Appears to Stay Solid

Despite the modest pullback seen in the ongoing session, the Bitcoin market continues to hold above key technical levels. Price weakness so far has been limited, keeping BTC positioned above critical support zones and sustaining the outlook for further upside movement.

The SRSI lines remain unfazed, continuing along a bullish path. As a result, bearish pressure appears negligible and could be easily absorbed, especially while price action remains above the 9-day EMA on the daily chart.

Bitcoin Price Prediction: BTC/USDT Pullback May Not Be Significant (4-Hour Chart)

On the 4-hour chart, price action is also holding above the 9-day EMA curve. The most recent candlestick is red, but closer inspection suggests that the bearish pullback remains shallow.

Bitcoin (BTC) Price Prediction: BTC/USDT Trades Above the $90,000 Baseline

The market continues to stay firm above the EMA, even on this shorter timeframe.

The SRSI indicator lines are currently in the oversold region and moving sideways. This setup suggests the possibility of a rebound from the $95,000 support area, which could open the door for another attempt toward the $100,000 level.

Get Bitcoin (BTC) here. Buy BTC 

GENIUS Act Alignment Pulls Western Asset Money Market Funds Into Regulated Stablecoin Infrastructure

Franklin Templeton announced on Tuesday that two Western Asset government money market funds to support regulated digital finance while keeping them fully registered with the U.S. Securities and Exchange Commission have been adjusted.

The firm said the changes were designed to serve stablecoin reserve needs and enable blockchain-based fund distribution, without altering the conservative nature of the products. It explained that the updates were aimed at meeting rising institutional demand for compliant liquidity tools as stablecoins expand across payments, settlement, and collateral use.

Treasury Fund Repositioned for Stablecoin Reserves

Franklin Templeton said the Western Asset Institutional Treasury Obligations Fund had been restructured to meet reserve standards under the GENIUS Act. It was stated by the firm that the fund is now only interested in investing, especially in U.S. Treasury securities with less than of 93 days lifespan. It stated that this adjustment positioned the fund for use by stablecoin issuers operating within the federal framework introduced in July 2025.

GENIUS Act Alignment Pulls Western Asset Money Market Funds Into Regulated Stablecoin Infrastructure

Additionally, it was noted by the firm that institutional issuers were seeking products that functioned as financial infrastructure rather than speculative investments. Franklin Templeton explained that the fund’s revised structure was meant to meet these expectations while maintaining strict risk controls.

Blockchain-Based Distribution Without Product Change

The company also said the Western Asset Institutional Treasury Reserves Fund had launched a Digital Institutional Share Class. It was explained that approved intermediaries could use blockchain systems to record and transfer ownership of fund shares. This is aimed at allowing faster settlement and continuous transaction access.

As it stands, Franklin Templeton emphasized that the fund itself remained a traditional money market product. It clarified that blockchain technology affected only the method of share distribution and recordkeeping, not the investment strategy or regulatory oversight.

Matt Jones, head of institutional liquidity, was reported to have said the updates showed the firm’s focus on combining innovation with strong operational discipline. Roger Bayston, head of digital assets, was quoted as saying the move responded to institutional demand for regulated products that worked smoothly within digital market systems.

The firm added that this step aligned with its long-term strategy of integrating blockchain into existing financial products, reflecting a wider industry shift toward interoperability rather than replacement.


In order to place winning trades with us via Bybit, you can open an account here.