Cardano (ADA) Price Long-Term Forecast: Bullish Cardano’s (ADA) price is recovering after breaking above the moving average lines as it attempts to surpass the $0.67 peak. The positive momentum has persisted since February 9. Buyers are hoping to push the altcoin towards its previous high of $0.67. The crypto asset has reached a high of $0.62 as of this writing. On the upside, if buyers break through the barrier at $0.67, the market will achieve a high of $0.75.
However, if the cryptocurrency’s price remains caught at the resistance level of $0.67, the altcoin will be forced to trade sideways. ADA/USD will trade above the moving average lines but below the resistance level at $0.67.
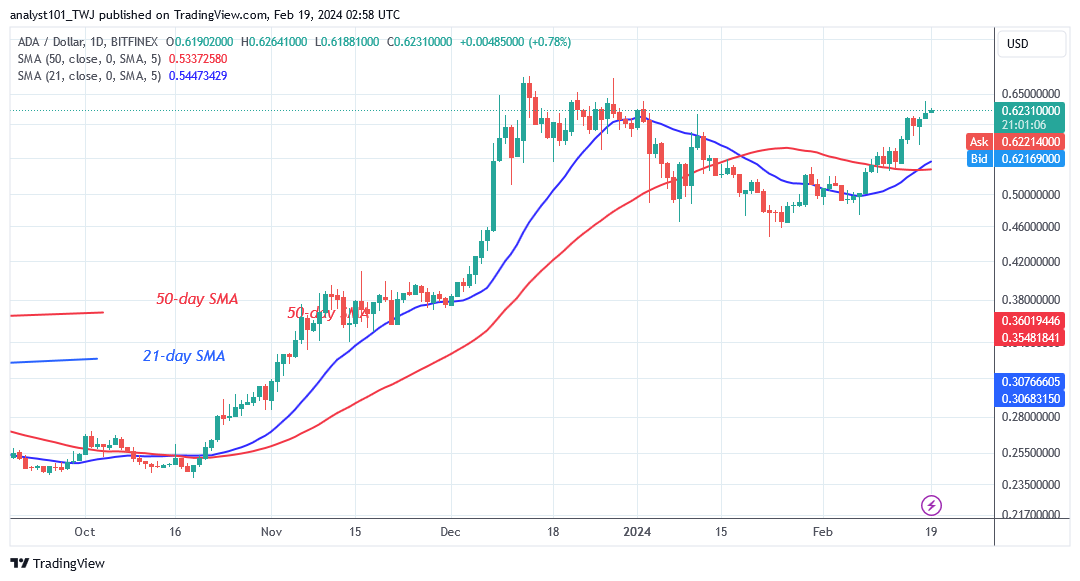
ADA/USD – Daily Chart
Technical Indicators: Major supply zones: $1.0, $1.05, $1.10 Major demand zones: $0.25, $0.20, $0.15
Cardano (ADA) Indicator Analysis The price bars for ADA are above the moving average lines as the altcoin continues to soar. The price bars were previously caught between the moving average lines. The altcoin will continue to increase while in the bullish trend zone. Cardano’s price resurgence has resulted in a bullish crossing. The 21-day SMA crosses above the 50-day SMA, indicating that traders may place bullish orders.
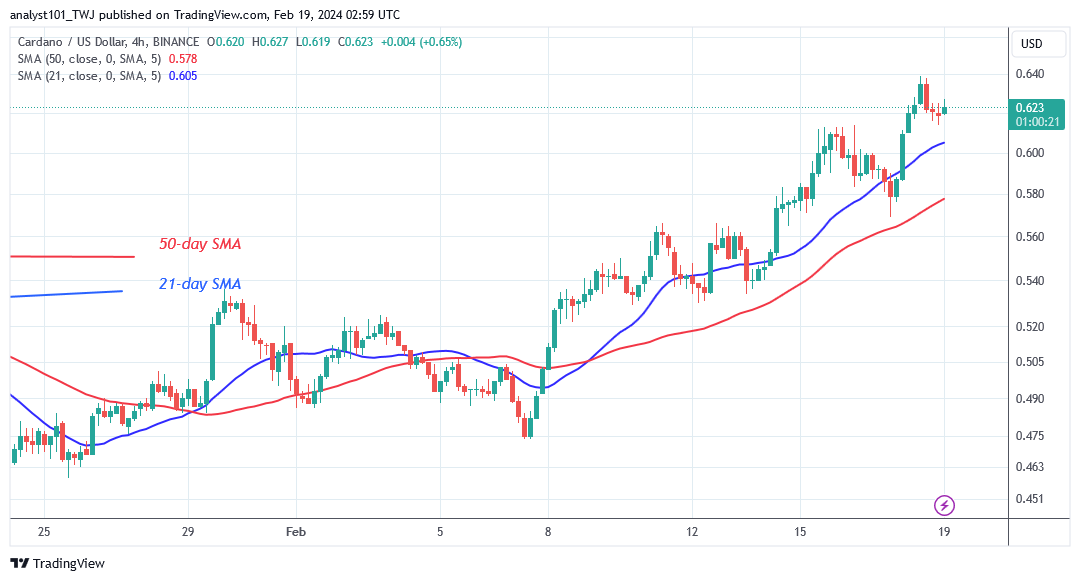
What Is the Next Move for Cardano (ADA)? On the 4-hour chart, the ADA/USD is in an uptrend as it attempts to surpass the $0.67 peak. The cryptocurrency price has been making a series of higher highs and higher lows. The current upswing has ended after reaching a high of $0.639 on February 18. For the past 24 hours, the altcoin has fluctuated below its recent high. Nonetheless, the crypto signal is favorable, as the altcoin is predicted to continue rising.
Note: Cryptosignals.org is not a financial advisor. Do your research before investing your funds in any financial asset or presented product or event. We are not responsible for your investing results
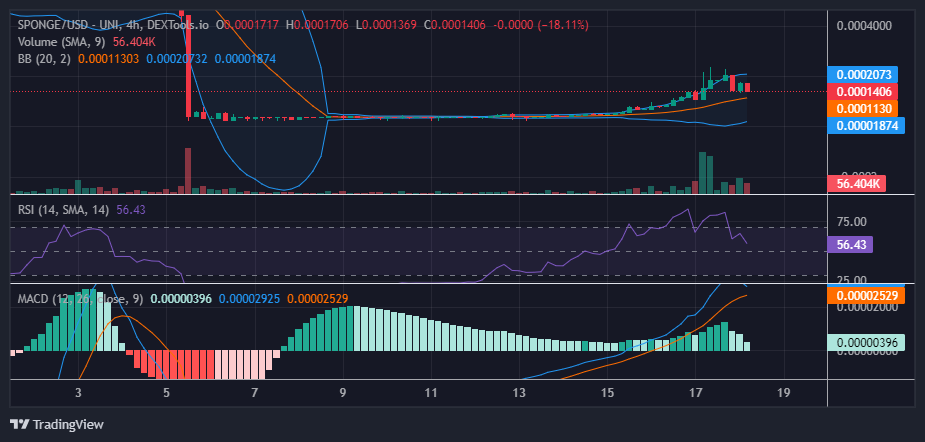
The SPONGE/USD market has initiated an upward trend, breaking away from the narrow trading range around the $0.000035 price level. There has been a significant surge in the market, pushing the price well beyond the $0.0001 mark, even surpassing $0.0002. This notable bullish movement prompted some profit-taking activity around the $0.0002 mark. Despite this resulting in a significant retracement, a new support level has emerged around $0.000145. It appears that bearish pressure is consistently being rejected at this level, strengthening it as a substantial support level that reinforces the continuity of the current bullish trend.
Key Market Dynamics:
Resistance Levels: $0.0010, $0.0011, and $0.0012.
Support Levels: $0.00010, $0.00008, and $0.000035.
In-Depth Technical Analysis for $SPONGE (SPONGE/USD)
The surge in bullish sentiment within the SPONGE/USD market is notably heightening market volatility. This increased volatility has bolstered bearish activity around the $0.0002 resistance level. Nevertheless, bullish investors are consolidating around the critical $0.000145 price level. Should they successfully defend this position, it is anticipated that the market will swiftly surpass another significant milestone, ensuring the persistence of the bullish trend.
However, there is a noteworthy concern regarding the Relative Strength Index (RSI) line, which is currently trending downward. This suggests that more traders may be inclined to take profits, potentially leading to market consolidation around the $0.000145 level. This consolidation, coupled with the prevailing bullish sentiment, could serve as a pivot point for the continuation of the upward trend.
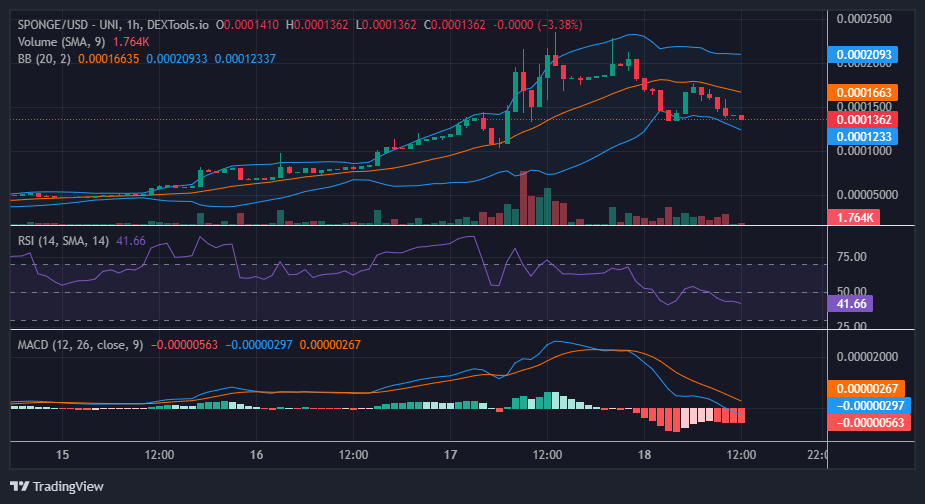
Insights from the 1-Hour Perspective:
Analyzing the 1-hour chart, it’s evident that the bullish stance at the $0.000145 price level is currently facing significant bearish pressure, with highs nearing this pivotal support level. To counteract the selling pressure arising from the resistance level surpassing $0.0002, a surge in bullish sentiment is imperative.
Both the Relative Strength Index and the Moving Average Convergence and Divergence indicator are presenting a crypto signal indicative of pronounced profit-taking activities, signaling a need for caution. Nonetheless, given the market’s persistent volatility, bullish investors have the potential to swiftly reclaim additional price territory.
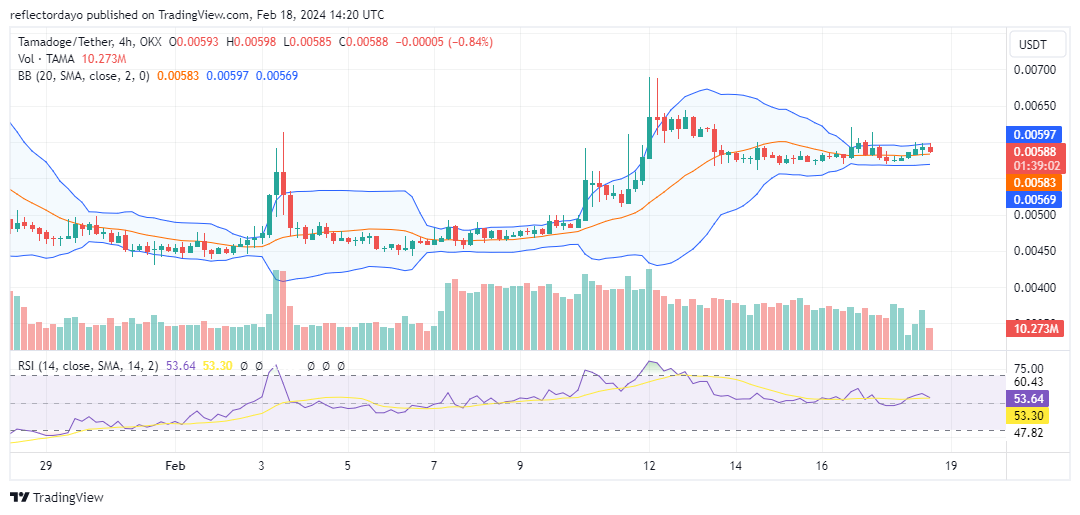
Breaking out of the narrow price range around $0.00453, attributed to market indecision, the market swiftly surged to $0.007. Subsequently, a bearish trend emerged from this level, briefly leading to a range slightly above $0.006 before stabilizing just below it. Presently, within the Tamadoge market, indications of burgeoning momentum are evident, suggesting the potential resurgence of the bullish market to attain higher price levels.
Key Levels
Resistance: $0.013, $0.014, and $0.015.
Support: $0.0045, $0.0040, and $0.0035.
TAMA/USD Price Analysis: The Indicators’ Point of View
On Friday, a notable Tamadoge bullish price movement was observed, yet it failed to correlate with the Bollinger Bands indicator, implying its unsustainability. Consequently, the standoff between demand and supply persisted. Furthermore, on the same day, the convergence of Bollinger Bands signaled a soon-narrowing price range, reflective of market indecision and a sign of a potential price breakout in the market. According to the crypto signal, these dynamics are anticipated to reinforce the $0.006 price level in shaping the upcoming price trend, ideally favoring a bullish move.
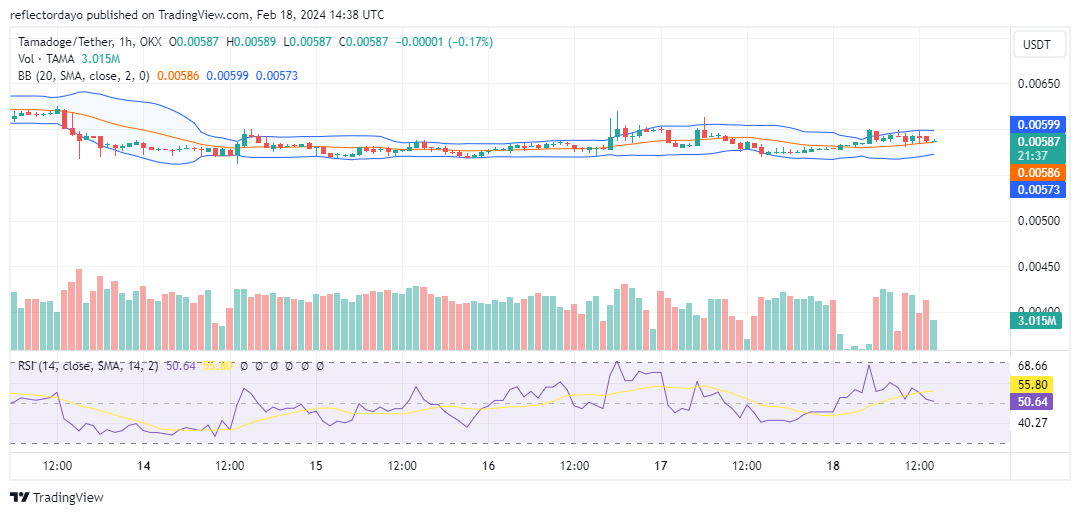
Tamadoge Short-Term Outlook: 1-Hour Chart
Zooming in into the 1-hour timeframe outlook, distinct fluctuations are evident in the movement of the RSI line. This observation underscores the sustained interest of investors in the Tamadoge market, as evidenced by their active participation in trading activities. Currently, the price hovers around the midpoint of the indicator, indicating an equilibrium price of $0.0059. In this scenario, analysts must rely on fundamental factors to forecast the market’s next direction, given the equilibrium between supply and demand.
Tamadoge is live on Polygon
Tamadoge 🤝 Polygon
Update:
🐶 TAMA V2 has been airdropped to the majority of wallets.
🐶 Playable Tamadoge NFTs on #Polygon have been sent to owners.
🐶 All Tamadoge apps have been update and $TAMA V2 prizes can be claimed.
It’s thrilling to witness Bitcoin, the King Coin, ascend once again to the top position on this week’s list of the top 5 trending coins. This week’s lineup of trending coins is indeed graced by none other than the king of crypto, reclaiming its throne after a resounding surge, reminiscent of its glory days in years past. But the spotlight isn’t exclusive; alongside this regal resurgence, a constellation of other coins has gleamed brightly, capturing the attention of investors far and wide.
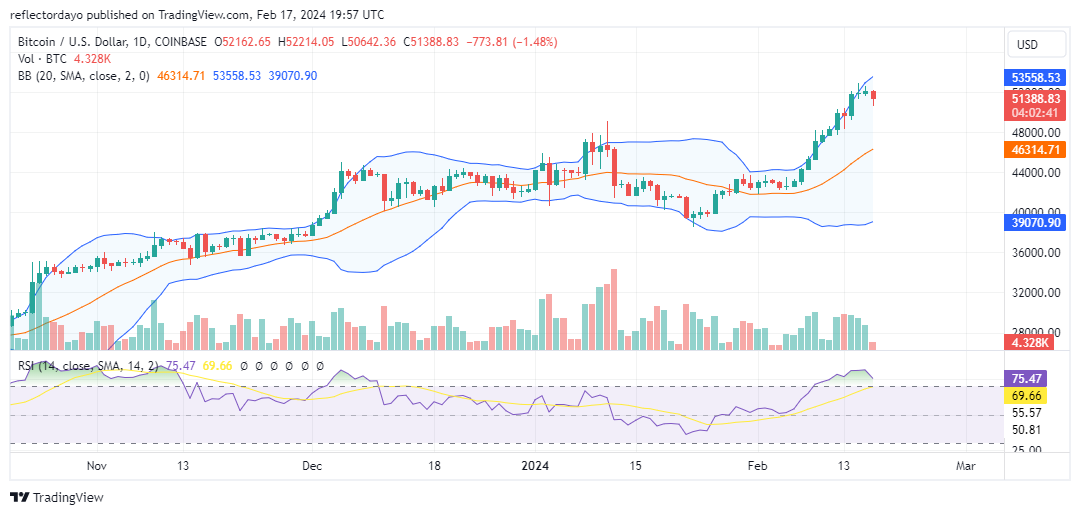
Bitcoin (BTC)
Major Bias: Bullish
Bitcoin has continued to maintain dominance on top of this week‘s trending coin list, despite registering some losses according to available metrics. Presently, the market has undergone a bearish correction of 1.16%. However, its surge of 8.34% over the past 7 days has ensured its position at the pinnacle of this week’s trending market. Its market cap looms large at a staggering $1.102 trillion, accompanied by a trading volume of $22.44 billion. Approximately 22 sessions ago, the market witnessed a rebound off the $40,000 support, propelling the token to higher levels and breaching both the $44,000 and $48,000 marks. However, recent sessions suggest waning momentum, with the market encountering resistance near the $52,000 mark.
From the perspective of the Relative Strength Index (RSI), the price correction may persist as the market appears to be overbought. The RSI line indicates signs of correction. Nevertheless, the current candlestick pattern suggests a prevailing bullish sentiment, resembling that of a hammer.
Current Price: $51,388.63
Market Capitalization: $1 trillion
Trading Volume: $19.7 billion
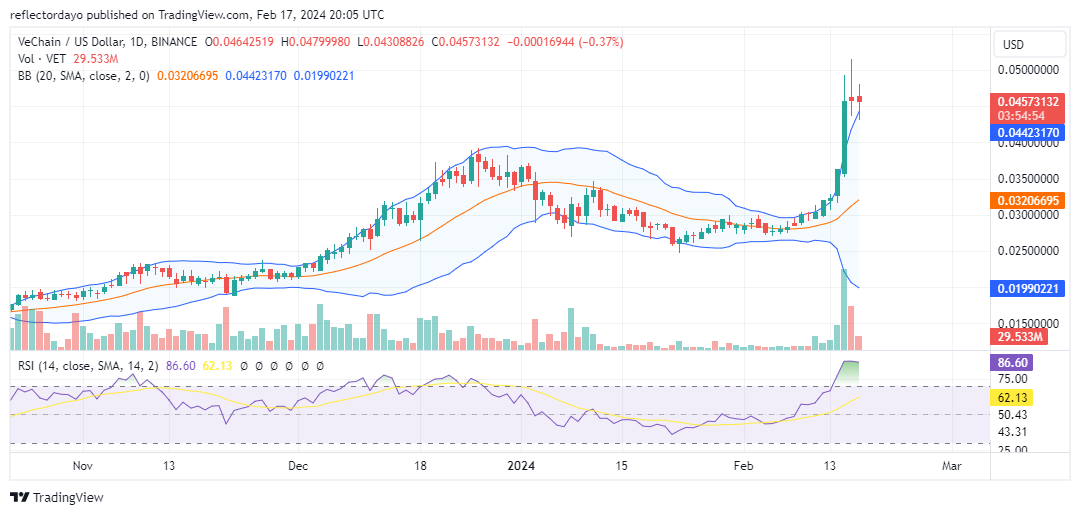
VeChain (VET)
Major Bias: Bullish
The VeChain market has exhibited significant bullish behavior, particularly evident during Wednesday and Thursday, where it gained notable momentum upwards. Thursday saw the market become particularly hyperbullish, leading to a peak above the $0.050 price level by Friday. However, the bearish momentum triggered at this level encountered substantial bullish pressure, resulting in price stagnation above the $0.045 mark.
Despite this stalemate, the Bollinger Bands indicator indicates high volatility. If this trend persists and the market fails to show a significant incline or decline, prices may consolidate sideways above $0.045. During this phase, volatility may decrease as the market prepares for a decisive price movement.
Current Price: $0.044
Market Capitalization: $3.2 million
Trading Volume: $233 million
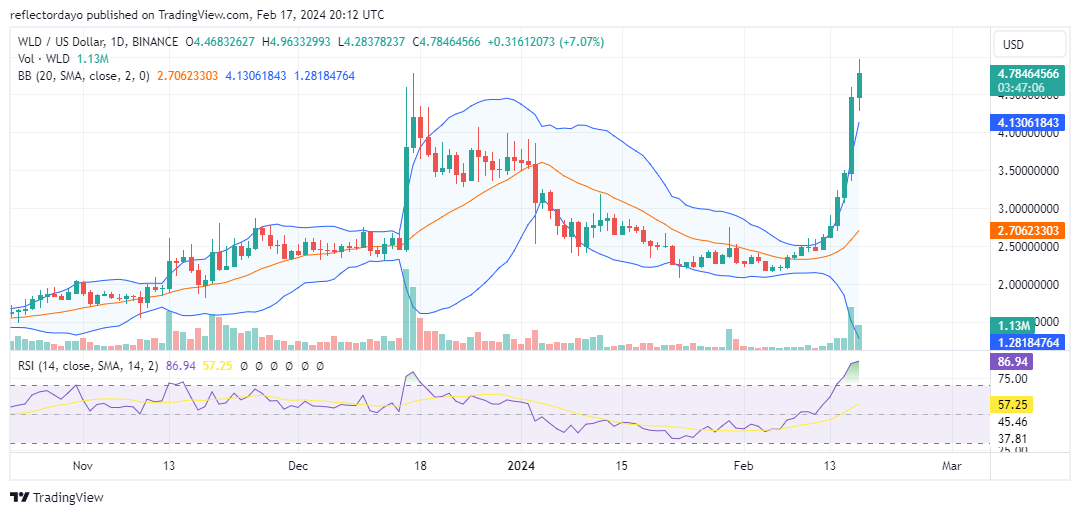
Worldcoin (WLD)
Major Bias: Bullish
The same trend as in the VeChain market can be observed on the chart for the Worldcoin market. This week has been remarkably dominated by bulls, causing an astronomical appreciation of the market. This strong, massive buying has also caused an escalation in the volatility level. By the time the market gets to a major bearish resistance level, the bear market might be just as strong as the bull market, and from the looks of the candlesticks having substantial upper shadows, the market may be nearing such a resistance level.
Current Price: $7.25
Market Capitalization: $629 million
Trading Volume: $498 million
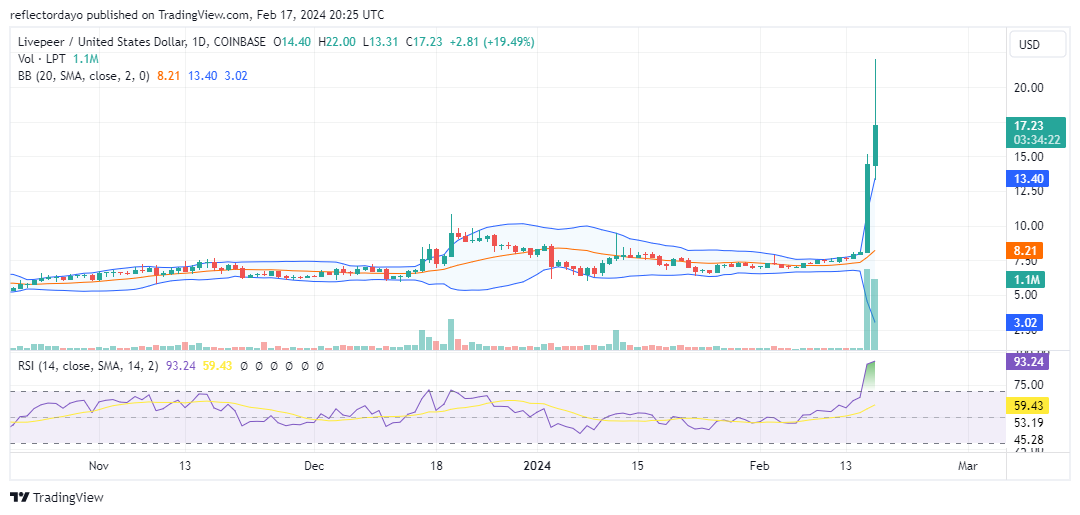
Livepeer (LPT)
Major Bias: Bullish
The surge of liquidity in the bull market between Friday and Saturday propelled the Livepeer market to the fourth position on this week’s top trending list. Prior to this surge, the volume of trade indicator had shown minimal activity, with histograms of small height and prices hovering around the $7.50 level. However, with the sudden uptick in the bull market, concerns have emerged regarding the potential strength of the retracement, especially as indicated by the Bollinger Bands, which portray a significant escalation in volatility levels.
Current Price: $17.38
Market Capitalization: $560 million
Trading Volume: $658 million
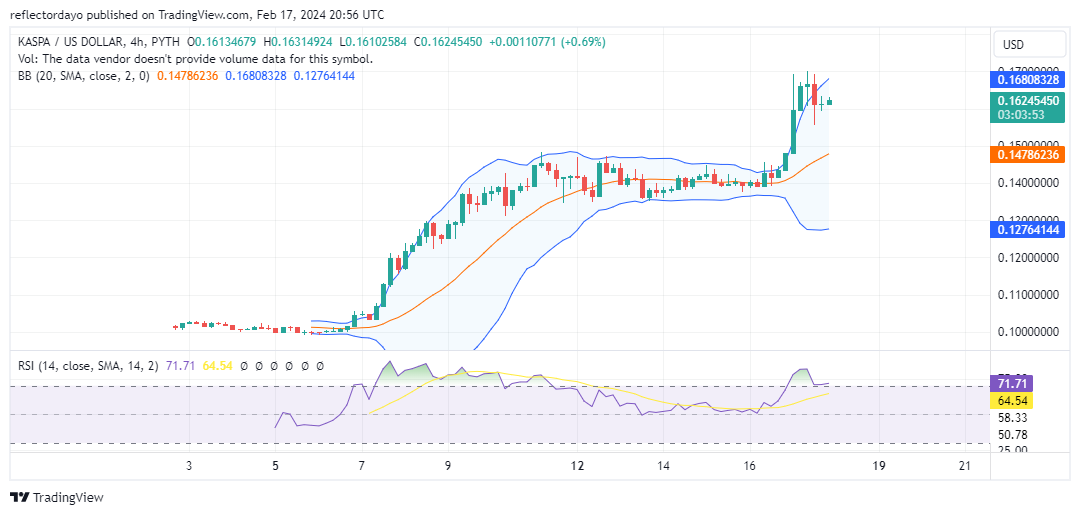
Kaspa (KAS)
Major Bias: Bullish
Ranked in the fifth position is the Kaspa market, seemingly a newcomer to the scene. Around February 7th, the market initiated an upward surge, but upon reaching the $0.1400 price level, it became stagnant for a period as bulls and bears engaged in a tug-of-war. During yesterday’s market sessions, however, the market broke out and settled above the $0.160 price level. While the Relative Strength Index (RSI) suggests the potential for a continuation of price correction, there’s a likelihood that the price will establish $0.16 as a support level. Securing a strong foothold at this elevated price level will likely steer the market in a bullish direction.
Market Analysis – Buyers Are Hoping for a Breakout
The compound shows weakness amidst breakout indications. Compound, a decentralized finance (DeFi) protocol, has garnered attention from traders and investors alike. In recent days, there have been indications of a potential breakout in the price of Compound. However, despite these indications, the buyers have yet to experience a significant price expansion.
Compound Price Levels
Resistance Levels: $68.740, $79.740 Support Levels: $45.000, $34.740
In recent days, the buyers of Compound have been actively participating in the market, pulling the strings and making their presence felt. Their efforts are visible, but they have yet to spread out more and create a substantial price expansion. The buyers’ actions indicate their interest in the potential growth of the compound.
The beginning of this year has been marked by strong volatility in the cryptocurrency market, and Compound is no exception. The sellers have made their presence known, trading aggressively and pushing the price down to the $45.000 key zone. Looking back to last year, the market experienced low volatility, particularly in December.
Currently, it remains unclear whether the buyers are capable of breaching the $60.680 significant level. This level holds importance as it could potentially open up opportunities for further gains. Traders and investors should closely monitor the market to gauge the buyers’ strength and their ability to overcome this challenge.
In the world of cryptocurrency trading, having access to accurate signals and indicators is crucial. The best crypto signals can provide traders with valuable insights and help them make informed decisions.
Market Expectation
Additionally, the Bollinger Band indicator on the daily chart is still showing signs of readiness to expand further, which could work in favor of the buyers. If the price does expand, it may lead to breaking more key levels and creating new opportunities.
Note: Cryptosignals.org is not a financial advisor. Do your research before investing your funds in any financial asset or presented product or event. We are not responsible for your investing results.
ENJUSD Analysis – Buyers Show Unwavering Determination
ENJUSD solid impulsive trade continues to beat sellers. In the world of cryptocurrency trading, there are moments when the market defies all odds and surprises even the most seasoned traders. Such is the case with ENJUSD, a cryptocurrency that has been making waves in recent weeks. Despite initial sell sentiment, the buyers have established solid ground and are now aiming for a breakthrough towards the significant level of $0.337100.
ENJUSD Key Levels
Resistance Levels: $0.337100, $0.429900 Support Levels: $0.253000, $0.202500
The sell traders had a strong foothold earlier this year, causing the price of ENJUSD to experience a significant slump. However, with the presence of more volatility in the market, the buyers were able to regain control and push the price higher. The bears initially brought the price down to the $0.337100 price zone, but the bulls eventually came to the rescue and successfully pulled the price forward. The buyers have shown an unwavering determination to continue their journey towards higher price levels.
Market Expectation
Despite facing resistance from sellers, they are unwilling to give up and will do everything in their power to maintain their momentum. This determination is evident in the Parabolic SAR (Stop and Reverse) indicator, which continues to signal a bullish trend and further expansion in the price of ENJUSD. Having foresight and access to the best forex signals can make a significant difference in a trader’s success. With the current market conditions, traders must anticipate a potential hit towards the significant level of $0.337100.
Note:Cryptosignals.org is not a financial advisor. Do your research before investing your funds in any financial asset or presented product or event. We are not responsible for your investing results.
Robert Kiyosaki voices disapproval of the Fed’s policies while recommending Bitcoin and gold as superior investment options in light of economic uncertainties.
Renowned financial educator and author of “Rich Dad, Poor Dad,” Robert Kiyosaki, has publicly voiced his criticism of the U.S. Federal Reserve (Fed) while advocating for Bitcoin, gold, and silver as superior investment options.
With over 2 million followers on the platform X (formerly Twitter), Kiyosaki has consistently expressed skepticism towards the policies of the U.S. central bank, which he contends have negative impacts on the economy and worsen wealth inequality.
Bitcoin Versus the Federal Reserve: Robert Kiyosaki’s Viewpoint
Recent statements from Robert Kiyosaki emphasize his conviction that Bitcoin offers greater reliability compared to the trust placed in the Federal Reserve.
On February 15, he voiced apprehension regarding the Fed’s influence on the U.S. economy, alleging that its policies have contributed to the financial struggles of the less affluent while favoring wealthy banking entities.
This critique coincides with a surge in Bitcoin’s value, with the cryptocurrency witnessing an 8% rise over the past week, reaching $51,802.
The financial educator suggests to his followers that they shift their focus away from the activities and statements of the Federal Reserve and instead view Bitcoin as a safer investment option.
This perspective resonates with a larger narrative embraced by Bitcoin advocates, who see the digital currency as “digital gold,” signifying its perceived worth as a secure asset during periods of economic uncertainty.
Market Trends and the Expansion of Bitcoin
Kiyosaki’s projections regarding Bitcoin’s potential growth stem from recent developments in the banking sector, indicating a notable departure from U.S. Treasuries towards gold.
This suggests a forthcoming decrease in gold prices, potentially dropping below $1,200. This transition is expected to further propel Bitcoin’s rise in the financial markets.
Moreover, substantial inflows of Bitcoin into spot Exchange-Traded Funds (ETFs), notably those overseen by BlackRock and Fidelity, have significantly contributed to the cryptocurrency’s swift price surge.
In a single day, these inflows soared to a record high of $701 million, reflecting robust investor confidence in Bitcoin.
The rise in Bitcoin’s value can be attributed to several factors, such as its expanding recognition as a credible investment avenue and the rising interest from institutional investors.
The significant investments in Bitcoin by prominent ETFs serve as evidence of the cryptocurrency’s growing legitimacy in the investment sphere, thereby reinforcing Kiyosaki’s advocacy of Bitcoin as a feasible alternative to conventional financial systems influenced by central bank policies.
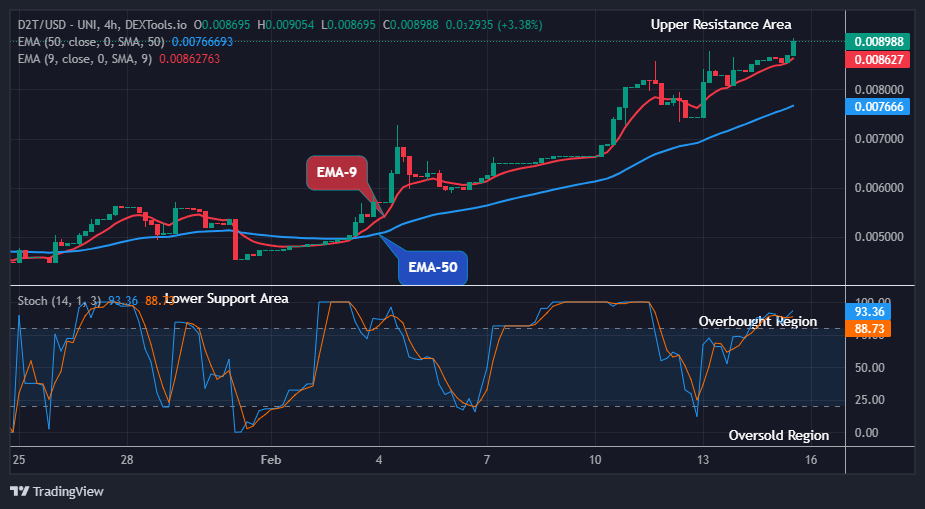
Dash 2 Trade Price Forecast: D2TUSD Looks Good for Long at $0.00905 Price Level (February 17) D2TUSD is currently displaying a promising uptrend. The digital asset’s value is now lingering above the critical $0.00869 resistance mark. The coin is trading in a strong bullish market and looks good for long at the $0.00905 current price level. The coin may likely increase further if the buying crew could push the coin price high and sustain above the current correction phase. Then we can expect a good upside momentum up to the $0.02000 upper resistance level and beyond. Hence, a great opportunity and a clear buy signal for long-term investors.
D2T (USD) Long-term Trend: Bullish (4H Chart) D2TUSD registered a positive market today. The coin price is trading in a strong bullish momentum above the two EMAs approaching the overhead resistance with huge volumes from the bulls and also looks good for the long at the $0.00905 price level. This looks nice for the buy trader and signifies a buy signal. The coin has been making higher highs and higher lows in previous actions; this has made it possible for the price to maintain an uptrend in recent times.
The coin buyers responded to the market and moved the price of Dash 2 Trade up to a high at the $0.00905 resistance mark above the moving average line close to the upper resistance level; this is an indication of more forces from the buy traders and looks good for long.
Based on the outlook, should the bulls go higher and close above the $0.00905 high mark, a bullish breakout confirmation will reflect the improved market sentiment.
In addition, the momentum indicator also signaled up indicating an uptrend. Buyers are expected to continue with the trend and in this case, the D2TUSD might reach the $0.02000 upper resistance value soon in its long-term perspective.
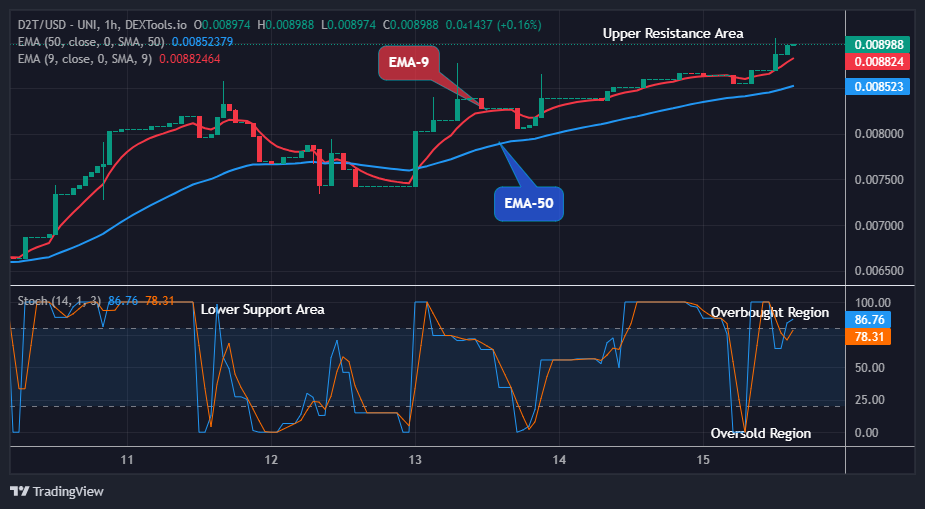
D2T (USD) Medium-term Trend: Bullish (1H Chart) Dash 2 Trade is in a positive movement today. The price is strongly trading in a bullish momentum in its medium-term time frame. This looks nice for the buy trader and signifies a buy signal. The pair is in a smooth uptrend as can be seen from the chart below. Pressure from the long-term traders at a $0.00563 high value in the previous action has sustained its upward stability in its recent high.
The pressure from the bulls to the $0.00866 supply value in the past action has sustained the price of Dash 2 Trade above the supply trend levels in its recent high.
At the time of writing, the D2TUSD price is now at the $0.00898 resistance trend line above the two EMAs as the 4-hour chart begins today, showcasing a growth of 2.71% in the last few hours. This is due to a high bullish impact on the market price.
In addition, D2TUSD still looks good for a long as indicated by the daily stochastic which is pointing in an upward direction. We can certainly expect more gains and strength from the coin as the bulls continue to dictate the market conditions. The pair may likely reach the $0.02000 upper resistance level in the days ahead in its medium-term perspective.
Smart Money Insights: Smart Money can be seen as individuals & entities who are seen as experienced & informed, often signaling future trends.
🚀Smart Money Insights📊
Smart Money is individuals & entities who are seen as experienced & informed, often signaling future trends.
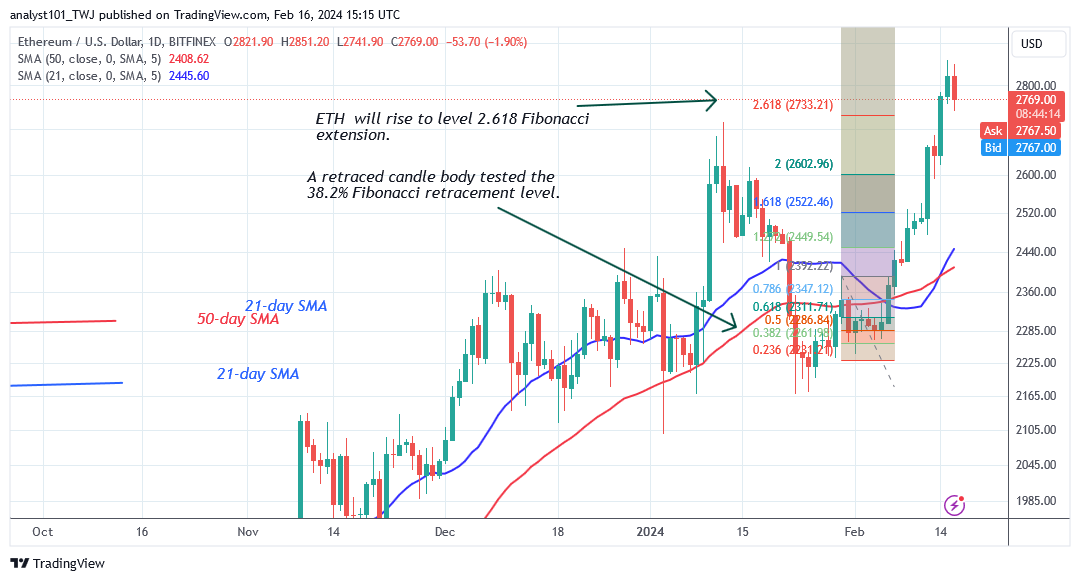
Ethereum Price Long Term Analysis : Bullish Ethereum’s (ETH) bullish momentum has surpassed the expected price of $2,733.21 as it targets the $3,000 mark. According to the price activity, Ether soared to a high of $2,858.90 before dropping back. It has now retraced to a low of $2,747.90 and is hovering just above the present support. If the current support holds, the uptrend will begin.
A break above the current high of $2,860 will send the altcoin soaring to a high of $3,000. However, if the bears breach the current support, selling pressure will resume. Ether will fall further, reaching a low of $2,659.30. Meanwhile, the altcoin is reverting to its prior highs.
ETH/USD – Daily Chart
Technical indicators: Major Resistance Levels – $2, 600, $2,800, $3,000 Major Support Levels – $1.600, $1, 400, $1,200
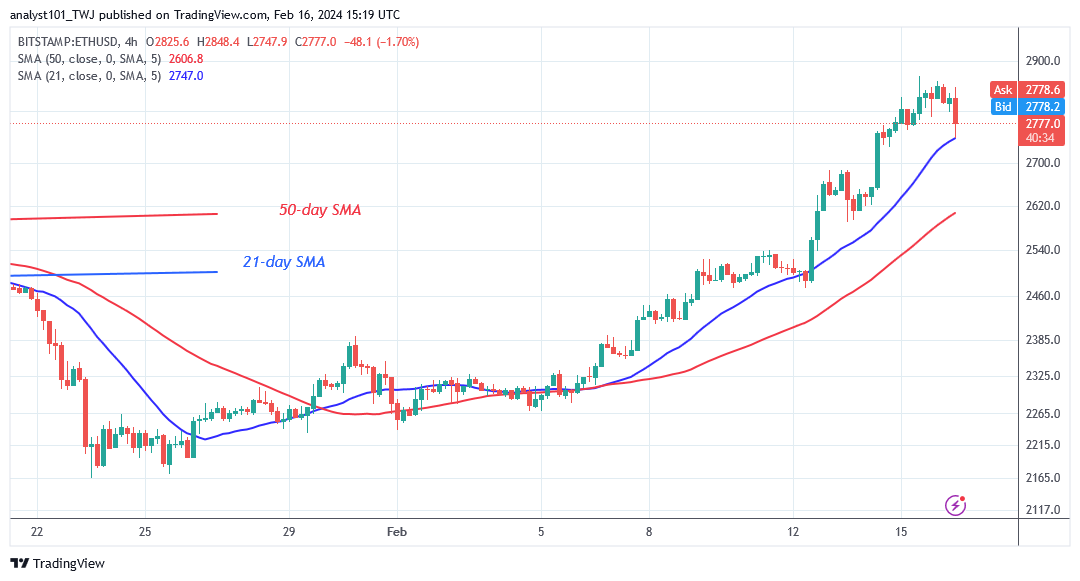
Ethereum Indicator Analysis Ether’s price bars are much above the moving average lines, surpassing the previous high of $2,715. Following the current decline, the price bars on the 4-hour chart have dropped below the moving average lines. This will force the altcoin to fall even lower, returning to its prior lows.
Conclusion Ethereum is preparing for the second leg of the upward momentum as it targets the $3,000 mark. On the 4-hour chart, the altcoin is currently trading between $2,740 and $2,860 price levels. When the biggest altcoin breaks through the resistance at $2,860, it will continue to rise. Nonetheless, the crypto signal remains bullish as it holds above the current support.
Note:Cryptosignals.org is not a financial advisor. Do your research before investing your funds in any financial asset or presented product or event. We are not responsible for your investing results