Uniswap (UNI/USD) Price Hits Resistances, Trading Above $9

Uniswap Price Prediction – February 29

An aggressive upsurge has occurred in the exchanging lines of Uniswap versus the market valuation of the US coin as the price hits resistances in the overhead barrier points between $12 and $13.

The price is reversing an upward surge that occurred on February 23rd, trading at roughly $10.93, indicating that a price convergence has been achieved. That careful-reasoning idea suggests that traders should use caution when taking any kind of position. However, purchasers might stick to their long-term investing strategy.

UNI/USD Market
Key Levels:
Resistance levels: $13, $14, $15
Support levels: $9, $8, $7

UNI/USD – Daily Chart
The UNI/USD daily chart reveals that the crypto market hits resistances between the points of $13 and $12, trading above $9.

A long bullish-engulfing candlestick has surfaced to give a crypto signal that would provide for getting a buy pathway back to higher points above the zone of $13, given that the Bollinger Band indicators have been firmly outstretched to the north side. The stochastic oscillators have continued to place northwardly around the point of 80, swerving mostly into the overbought region.
Uniswap (UNI/USD) Price Hits Resistances, Trading Above $9

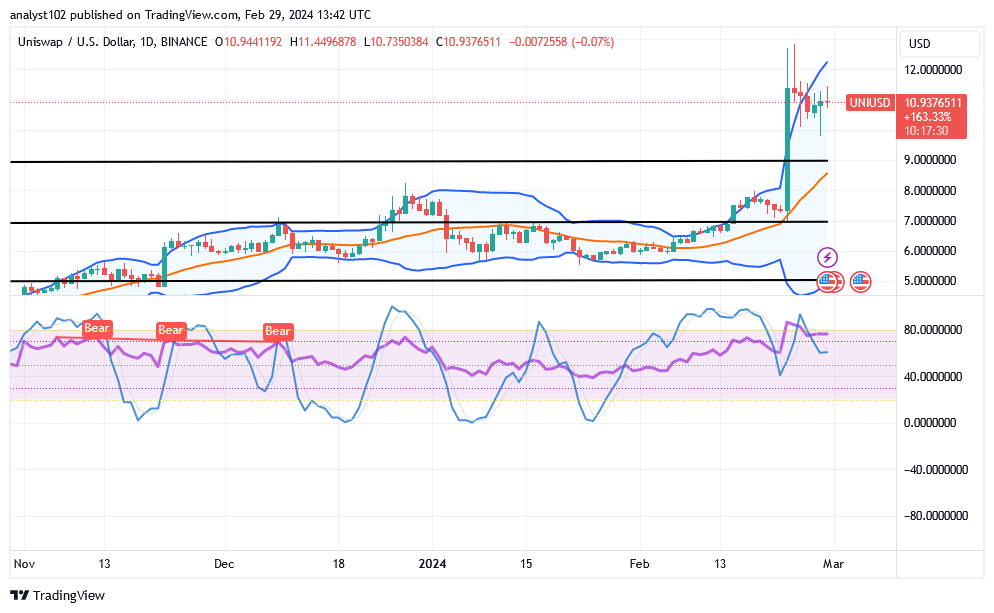
What is the critical underlying trade line to the current trade style of the UNI/USD market?

More focus has to shift to the underlying support line of $9 because if the price tends to intensify moves to break downward past it, it will lead to more lows, given that the UNI/USD market hits resistances between $13 and $12, trading above the point earlier mentioned.

For the bulls in the UNI/USD market, a crucial line of technical analysis is that the $9 support level hasn’t been decisively broken to the south. In the long run, the trading line might be the place to return to a favorable entry point for upswings in an effort to eventually surpass the previous high barrier spot.

Given the minor inclination in the upper Bollinger Band trend line, a shield is probably going to emerge beneath the $13 resistance line. Additionally, sellers will benefit from some points of entry adjacent to the confluences if that assumption proves to be accurate. Pushes that might break out against the value line should cause sellers to exercise caution.
Uniswap (UNI/USD) Price Hits Resistances, Trading Above $9
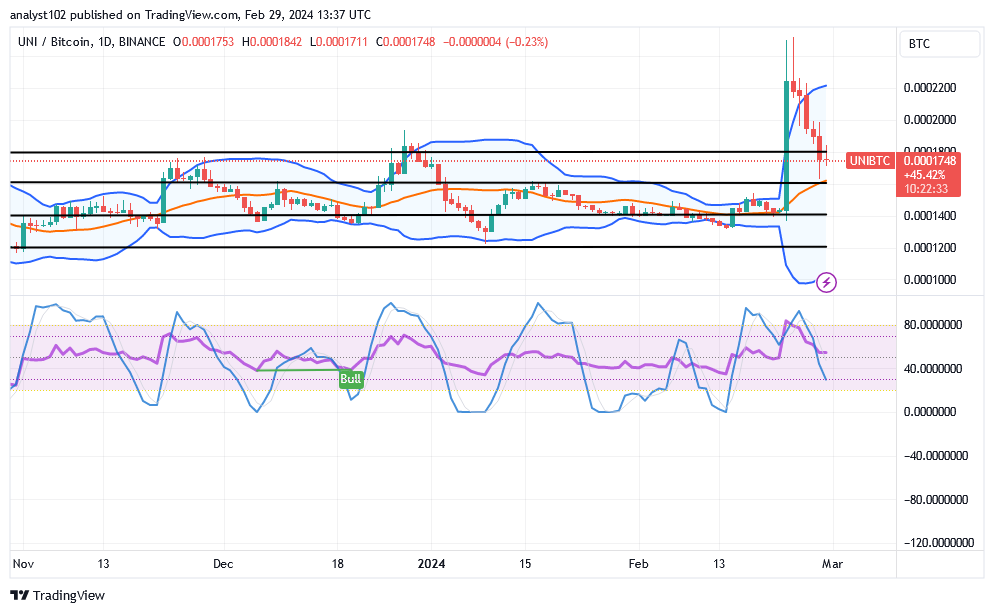
UNI/BTC Price Analysis
In contrast, the Uniswap market hits resistance at the top of the upper Bollinger Band against the worth of Bitcoin, trading above the middle Bollinger Band trend line.

A pattern of bearish candlesticks has developed over the course of a few days, suggesting that the base cryptocurrency is in reversion mode. The Bollinger Band trend lines have expanded significantly to the upside, indicating the formation of some forces that will improve the pairing instruments’ long-term prognosis. The stochastic oscillators have moved toward the south, approaching the 40-point. It appears from the indicators that purchasers should exercise caution while making new purchases at this time of writing.
\
Note: Cryptosignals.org is not a financial advisor. Do your research before investing your funds in any financial asset or presented product or event. We are not responsible for your investing results.


You can purchase Lucky Block here. Buy LBLOCK

Worldcoin Token Drops Sharply Amid OpenAI Lawsuit

Worldcoin, a cryptocurrency project known for offering tokens in exchange for eye scans, encountered a setback on Friday as its affiliated company, OpenAI, was sued by Elon Musk, one of its co-founders. Musk, who also owns the social media platform X, filed a lawsuit against OpenAI and its CEO, Sam Altman, alleging breach of contract.

The lawsuit, filed on Thursday, claims that OpenAI and Altman violated agreements made with Musk when he helped establish the artificial intelligence research company in 2015. At that time, Musk and Altman served as co-chairs of OpenAI.

Altman, in addition to his role at OpenAI, is a board member and co-creator of Worldcoin, which aims to establish a global digital identity system and distribute its tokens to every individual worldwide. The project has faced criticism for its approach to scanning people’s eyes using a spherical device, which some deem invasive and potentially unethical.

Worldcoin Token Records Rollercoaster Ride Today

Following news of the lawsuit, Worldcoin’s token (WLD) experienced a 10% decline in the late-Asian-early-London session on Friday. The token, which had reached a daily high of $8.43 in the Asian session, dropped to as low as $7.52 before rebounding slightly. As of the time of this report, WLD is trading at $8.06, showing resilience despite the morning dip.

Worldcoin Token Drops Sharply Amid OpenAI Lawsuit
WLDUSDT Hourly Chart

The lawsuit comes amidst rapid growth and innovation in the artificial intelligence industry. Over the past year, several AI-related tokens have surged in value following positive developments in the sector.

For example, in February, Nvidia, a leading chipmaker, reported better-than-expected earnings for the fourth quarter, and OpenAI launched a new product capable of generating videos from text.

OpenAI, founded with the vision of creating and sharing beneficial artificial intelligence for humanity, has received substantial funding and support from Microsoft. In January 2023, Microsoft announced a “multiyear, multibillion-dollar investment” in OpenAI to “accelerate AI breakthroughs.” However, Reuters reported in December that Microsoft does not own a stake in OpenAI.

The lawsuit indicates Musk’s discontent with the direction and governance of OpenAI. According to the Financial Times, the lawsuit aims to ensure that OpenAI adheres to its original mission of serving the common good and does not develop technology that favors specific individuals or companies.


Interested in learning how to day trade crypto? Get all the information you need here

Biconomy (BICO/USD) Surpasses $0.400 Resistance and Aims for Stronger Support Beyond $0.500

The $0.4 and $0.5 price levels have presented formidable resistance since December of last year, effectively forming a significant resistance zone in the Biconomy market. Notably, today’s trading session has exhibited robust bullish momentum, successfully breaching these key resistance barriers. As a result, this bullish surge has triggered an uptick in volatility levels, with the $0.5 resistance, in particular, now establishing itself as a formidable barrier to further upward movement.

Biconomy Market Data

  • BICO/USD Price Now: $0.497
  • BICO/USD Market Cap: $328 million
  • BICO/USD Circulating Supply: 667 million
  • BICO/USD Total Supply: 1 billion
  • BICO/USD CoinMarketCap Ranking: #192

Biconomy (BICO/USD) Surpasses $0.400 Resistance and Aims for Stronger Support Beyond $0.500

Key Levels

  • Resistance: $0.50, $0.53, and $0.55.
  • Support: $0.40, $035, and $030.

Biconomy Market Analysis: The Indicators’ Point of View

The current trading session has witnessed a notable surge in bullish activity, with the price movement effectively establishing the $0.40 level as a support threshold, thereby aligning the Biconomy market with its overarching bullish trend. Furthermore, this crypto signal indicates a sufficient volume of trade, as evidenced by the indicator histogram, bolstering confidence in the strength of this bullish market movement. Despite heightened volatility, particularly evident in the robust bearish resistance at $0.50, there remains potential for the continuation of this bullish momentum. Noteworthy is the significant Biconomy price correction observed following the breach of the key resistance level.

Although the Bollinger Bands signal escalating market volatility, the 20-day moving average maintains its bullish trajectory. Consequently, the market’s actual performance may see a close near, above, or at the $0.50 mark.

Biconomy (BICO/USD) Surpasses $0.400 Resistance and Aims for Stronger Support Beyond $0.500

BICO/USD 4-Hour Chart Outlook

At the $0.5 price level, there is a notable tug-of-war between bullish and bearish forces vying for dominance in the market. The robust volume of trade histogram, indicative of the current trading session, underscores heightened investor interest. However, both bullish and bearish sentiments appear to be in a deadlock, resulting in a market impasse. Should the bullish side fail to secure a stronger support level in close proximity to $0.5, a market reversal could be imminent.

Trade crypto coins on BYBIT!

$SPONGE (SPONGE/USD) Treads Lightly Around $0.000045 with Modest Fluctuations

The SPONGE Token (SPONGE/USD) stands firm, and its value continues with graceful unpredictability around the threshold of $0.000045. This seemingly minuscule figure carries immense weight, a testament to its enduring presence amidst the tumultuous seas of market volatility. Here, amidst the ebb and flow of bullish and bearish sentiments, a delicate equilibrium is maintained, with the bulls showing subtle signs of favor.

Key Market Dynamics:

  • Resistance Levels: $0.0010, $0.0011, and $0.0012.
  • Support Levels: $0.000035, $0.000030, and $0.000025.

$SPONGE (SPONGE/USD) Treads Lightly Around $0.000045 with Modest Fluctuations

In-Depth Technical Analysis for $SPONGE (SPONGE/USD)

The tapestry of market dynamics reveals a tale of struggle and resilience. Lower highs emerge as harbingers of bullish momentum, signaling an impending breakthrough in the impasse gripping the market. Despite the relentless onslaught of bearish pressures, the SPONGE/USD market remains resolute, with bullish traders fortifying their positions at higher low price levels, laying siege upon the stronghold of $0.000045.

$SPONGE (SPONGE/USD) Treads Lightly Around $0.000045 with Modest Fluctuations

Insights from the 1-Hour Perspective:

From the vantage point of the 1-hour chart, the battleground is laid bare. Bulls and bears engage in a fierce tug-of-war, their struggles immortalized in the wax and wane of candlesticks. A lone bullish candle, accompanied by a surge in trading volume, offers a glimmer of hope amidst the darkness of indecision. Yet, the ominous presence of four-price dojis serves as a stark reminder of the fragile balance that hangs in the air.

As the tides of sentiment shift and sway, traders stand vigilant, ever-watchful for the slightest hint of a reversal. In this ever-changing landscape, adaptability is key as traders use dynamic crypto signals to navigate the turbulent waters of uncertainty, armed with nothing but their wits and a keen eye for opportunity.

Buy SPONGE/USD!

Invest in the hottest and best meme coin. Buy Sponge ($SPONGE) today!

Reaching New Heights: Crypto Marketers Shift Focus to Older Generations

Is Bitcoin a viable investment option for baby boomers? Recent ad campaigns seem to answer with a resounding yes. These campaigns follow the Securities and Exchange Commission’s approval on Jan. 10 of the first U.S. exchange-traded funds directly holding Bitcoin.

From industry giants like BlackRock to niche players like Bitwise Asset Management, firms are now rolling out Bitcoin ETFs. With nearly identical products, marketing becomes paramount in setting them apart, as noted by Eric Balchunas, an analyst at Bloomberg Intelligence. Many of these firms are honing in on an audience of older, wealthier, and more risk-averse advisers and investors.

Describing baby boomers as “the best generation” and bitcoin as a hedge against government devaluation, VanEck and others are investing heavily in TV commercials, targeting financial news shows like “Squawk Box” and “Cavuto: Coast to Coast.”

Reaching New Heights: Crypto Marketers Shift Focus to Older Generations

Unlike the flashy crypto ad blitz of the pandemic era, these ETF campaigns are expected to take a more subdued approach, devoid of celebrity endorsements like those seen with Tom Brady for FTX. Bitwise’s pre-SEC decision ad, featuring Jonathan Goldsmith, known for his role in Dos Equis’ iconic campaign, highlights a strategic move to capitalize on interest in Bitcoin without promoting a specific product.

Expanding Horizons: Hashdex, a crypto-focused investment firm, launched two pre-SEC approval videos aimed at garnering recognition among older demographics, explained Chris Glendening, head of marketing.

Regulators are adamant about ensuring transparency in marketing materials for these funds, stressing the need for clear disclosures regarding the risks tied to speculative assets, noted Gluck, senior director at Finra. Potential losses from theft of private keys or fraud must be communicated prominently in campaigns, possibly via voice-over, rather than relegated to slides at the end of videos, Gluck emphasized.

“Regulation doesn’t equate to safety,” cautioned Gluck, underscoring the importance of accurate perceptions about bitcoin’s risks.
Despite regulatory oversight, digital advertising avenues for these firms are expanding.

Reaching New Heights: Crypto Marketers Shift Focus to Older Generations

Alphabet has begun greenlighting ads for bitcoin ETFs on platforms like Google Search and YouTube in the U.S. post-SEC approval, as confirmed by a spokesperson. Meta Platforms, the parent company of Facebook and Instagram, is also revising its U.S. policies in light of the SEC’s decision, according to a spokesperson.

Not all approved Bitcoin ETF campaigns target older demographics.
Some established asset managers are embracing crypto aesthetics in their communications to build rapport with the Bitcoin community. VanEck’s inaugural TV ad for its HODL bitcoin ETF, for instance, features nods to crypto culture, including scenes shot at Pubkey, a bitcoin-themed bar in Manhattan, shared Vicki Chan, content strategy director.

Meanwhile, Grayscale Investments is leveraging its longevity and size in the crypto ETF market through TV and airport ads, positioning itself as a pioneer. Rather than solely focusing on older investors, the firm aims to use humor to engage a wider audience, explained Chief Executive Michael Sonnenshein.

“We view investing in this asset class as a unique opportunity,” Sonnenshein expressed, highlighting their strategy to appeal across generations and investor types.

Dash 2 Trade Price Predictions for Today, March 1: D2TUSD Price Targets $0.02000 Supply amidst Market Surge

Dash 2 Trade Price Forecast: D2TUSD Price Targets $0.01000 Supply amidst Market Surge (February 29)
D2TUSD is facing a new correction to resume its upward rally. The coin price targets the $0.02000 supply amidst the recent market surge. Meanwhile, the coin will still go further if the current support at $0.00776 holds. The crypto’s price may continue its upside moves to retest the $0.01232 previous high level which could further target the $0.02000 supply amidst the market surge, provided buyers increase their actions in the market.

Key Levels:
Resistance levels: $0.00700, $0.00800, $0.00900
Support levels: $0.00500, $0.00400, $0.00300

D2T (USD) Long-term Trend: Bearish (4H Chart)
Dash 2 Trade is bearish in its long-term outlook. The price responded to the shift in the market structure and is currently trading below the moving averages.
Dash 2 Trade Price Predictions for Today, March 1: D2TUSD Price Targets $0.02000 Supply amidst Market Surge
The bearish interference on the crypto at the $0.00776 support level in the last session has made it stay below the EMAs in its recent price level.

The altcoin has completed its downside moves and is now set for an upswing. With positive sentiment, the bulls rallied up to the $0.00779 resistance value below the moving averages as a pullback and breached the $0.00776 barrier as the 4-hourly chart opens today.

Thus, a possible breakout from the $0.00822 neckline will accelerate the buying momentum and push the prices of D2TUSD higher to hit the 0.01232 previous resistance levels. This will bolster more buying pressure on the crypto to the upper resistance levels.

Notably, the market is now pointing up below the 5% range of the daily stochastic. This means the crypto market is oversold and the emergence of bullish pressure is crucial at this moment. Hence, the bulls are expected to turn around the price of Dash 2 Trade and the target might be the $0.02000 supply value amidst a market surge in the days ahead in its higher time frame.

D2T (USD) Medium-term Trend: Bullish (1H Chart)
D2TUSD indicates an upward trend with a bullish sentiment in its medium-term perspective. The coin is trading above the level of $0.00776 while facing resistance at the recent high
Dash 2 Trade Price Predictions for Today, March 1: D2TUSD Price Targets $0.02000 Supply amidst Market Surge
The high bullish impact on the crypto at the $0.00776 high level in the previous action has contributed to its bullishness in its recent high.

Earlier today, the bulls caused a rise in the price of Dash 2 Trade to a high at $0.00779 level above the EMA-9, facing the upper high level.

However, the currency pair could grow further if the buy traders managed to break up the $0.01232 previous high level, maintaining a further growth potential for the buy traders.

Hence, with the price pointing upwards on the daily stochastic means that further upside is certain. It is therefore expected that the buy investors will move the price action of D2TUSD up and may likely hit the $0.02000 supply level soon in its higher time frame.

Dash 2 Trade launch month in review: At Dash 2 Trade Headquarters, this month has been fruitful and satisfying.


Want a coin that has a huge potential for massive returns? That coin is Dash 2 Trade. Buy D2T now.

$SPONGE (SPONGE/USD) Sees Modest Fluctuations Around $0.000045 Amidst Market Search for Rebound Potential

The $SPONGE market demonstrates resilience at the $0.000045 mark, which holds significant importance owing to its enduring presence and its capacity to accommodate price fluctuations in either direction. Furthermore, this level has proven pivotal in resisting bearish pressures, impeding the bear market’s advancement beyond this threshold. Despite an ongoing tug-of-war between bulls and bears around this level, subtle shifts favoring the bulls have been discernible.

Key Market Dynamics:

  • Resistance Levels: $0.0010, $0.0011, and $0.0012.
  • Support Levels: $0.000035, $0.000030, and $0.000025.

SPONGE Token (SPONGE/USD) Sees Modest Fluctuations Around $0.000045 Amidst Market Search for Rebound Potential

In-Depth Technical Analysis for $SPONGE (SPONGE/USD)

The emergence of lower highs is becoming increasingly evident on the chart, indicating bullish momentum aimed at breaking the market’s impasse. Besides demonstrating strength below the $0.000045 price level through prompt rejection of bearish price movements, bullish traders in the $SPONGE market have exhibited resilience by initiating bullish positions at relatively higher low price levels. This crypto signal suggests a mounting pressure on the $0.000045 price level, potentially facilitating its eventual breakout from the current gridlock.

SPONGE Token (SPONGE/USD) Sees Modest Fluctuations Around $0.000045 Amidst Market Search for Rebound Potential

Insights from the 1-Hour Perspective:

Upon analyzing the market from a 1-hour chart perspective, it is evident that while bullish strength is notable at the lower end of the $0.000045 range, bears are also demonstrating resilience above this level. Notably, during the last third of the 1-hour session, a significant bullish candle accompanied by pronounced trading volume was observed. Subsequent sessions featured two four-price dojis, signaling indecision and underscoring the ongoing struggle between bulls and bears. Despite the prevailing downside testing, a potential reversal in market sentiment may occur if buying pressure unexpectedly intensifies or selling pressure diminishes. It is imperative for traders to closely monitor price action and volume, enabling them to identify signs of a potential reversal and adjust their trading strategies accordingly.

Buy SPONGE/USD!

Invest in the hottest and best meme coin. Buy Sponge ($SPONGE) today!

Bitcoin Trading Volume Hits Record High as Price Nears $69,000

Bitcoin, the world’s leading cryptocurrency, has experienced a remarkable surge in trading volume and price during February 2024. According to data from Kaiko, a prominent on-chain analytics firm, Bitcoin’s trading volume soared to an all-time high of $34.05 billion on February 28, surpassing its previous peak of $27.22 billion recorded on January 8.

Bitcoin Trading Volume Hits Record High as Price Nears $69,000
Image via Kaiko

This surge in trading volume marks a significant milestone, being the first since the collapse of FTX, a major cryptocurrency exchange. The majority of the trading volume was driven by Binance, the world’s largest cryptocurrency exchange, with Bitcoin trading volume on the platform reaching $17.09 billion.

Other exchanges also witnessed substantial volumes of Bitcoin trading, including Bybit ($3.5 billion), Coinbase ($2.98 billion), OKX ($2.92 billion), and Kraken ($1.05 billion).

Bitcoin Trading Volume Hits Record High as Price Nears $69,000
Image via Kaiko

In addition to the surge in trading volume, the number of Bitcoin trades also reached a new high on February 28, totaling 23.25 million with an average trade size of $1.46k. This indicates a high level of interest and activity among both investors and traders in the cryptocurrency market.

Bitcoin Set for Best-Performing Month on Record

Bitcoin’s price has also been on a strong upward trend, gaining nearly $20,000 since the beginning of February. As of February 29, Bitcoin was trading near $62,500, reflecting a 6% increase in the last 24 hours. The cryptocurrency is edging closer to its all-time high of $69,000, achieved on February 21.

Bitcoin Trading Volume Hits Record High as Price Nears $69,000
BTCUSD Daily Chart

According to Coingecko, a cryptocurrency data provider, Bitcoin’s monthly gain of $19,976 in February is the largest ever recorded in U.S. dollar terms. This surpasses the previous record of $17,978 in October 2021, followed by $15,467 in February 2021.

Bitcoin’s performance in February has outpaced most other asset classes, including stocks, bonds, gold, and oil, in terms of monthly returns.


Interested in learning how to day trade crypto? Get all the information you need here

Tamadoge (TAMA/USD) Defies Downtrend, Eyes Potential Rally

Following its February 21st high of $0.00688, TAMA/USD entered a downtrend. However, this downtrend became contained within a sideways range established by buying pressure at the $0.0055 price level. Ideally, from a bullish perspective, the bearish momentum will exhaust itself as it grapples with this support level.

Key Levels

  • Resistance: $0.013, $0.014, and $0.015.
  • Support: $0.0045, $0.0040, and $0.0035.

Tamadoge (TAMA/USD) Defies Downtrend, Eyes Potential Rally

TAMA/USD Price Analysis: The Indicators’ Point of View

The repeated rejection of downward price movements at the support level suggests the strength of the TAMA/USD and the potential for the downtrend, initiated on February 21st, to be contained. Recent trading sessions have exhibited frequent lower shadows on the candlesticks, which can be interpreted as a potential buildup of bullish pressure.

Furthermore, the Bollinger Bands indicator displays increasing volatility, as evidenced by widening bands. This expansion can sometimes precede a price breakout.

Tamadoge (TAMA/USD) Defies Downtrend, Eyes Potential Rally

Tamadoge Short-Term Outlook: 1-Hour Chart

The 1-hour chart reveals significant trading activity despite lacking a clear directional bias in price movement, indicating market indecision. This prolonged consolidation phase follows the recent downtrend that reached a low of $0.0055. While some investors, from the point of of this crypto signals, anticipate an imminent rally, the extended consolidation suggests potential delays.

If the price rises, the $0.0055 level could act as support. However, it’s important to acknowledge this as a potential outcome, not a certainty. Investors should monitor market developments and prepare their strategies accordingly.

Before midnight, lock in your top scores to receive your portion of $TAMA.

Do you want a coin that will be 100 times more valuable in the next few months? That is Tamadoge. Buy TAMA today!