Crypto Inflows Surge, Nearing Annual Record: CoinShares Data

Digital assets have experienced a remarkable week, this past week, with crypto inflows into investment products surpassing a substantial $2.7 billion, per the latest data from CoinShares. This surge brings the year-to-date total to an impressive $10.3 billion, edging closer to the all-time high of $10.6 billion recorded in 2021.

The market’s vigor is further highlighted by a record-breaking weekly trading turnover, reaching $43 billion, a significant increase from the previous week’s $30 billion.

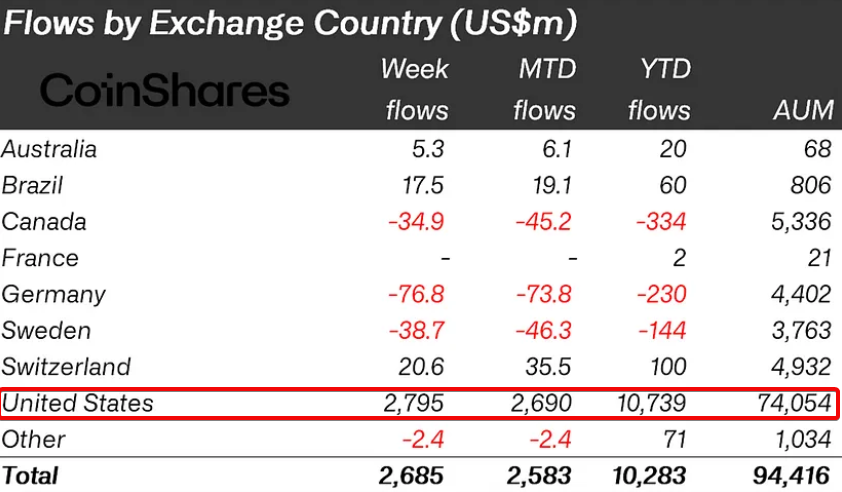
The report also indicates that the recent price uptick has driven total assets under management (AuM) to a new peak of $94.4 billion, showing a robust 14% growth over the past week and an 88% increase since the beginning of the year.

The US Records Over $2.8 Billion in Crypto Inflows to Lead the Market this Week

A regional breakdown shows that the United States leads with $2.8 billion in inflows, followed by Switzerland and Brazil with noteworthy inflows of $21 million and $18 million, respectively. However, Canada, Germany, and Switzerland have seen profit-taking activities, resulting in outflows of $35 million, $77 million, and $39 million, respectively.

Crypto Inflows Surge, Nearing Annual Record: CoinShares Data
Image via CoinShares

Bitcoin remains a focal point for investors, with $2.6 billion in inflows now making up 14% of the total AuM. Interestingly, even with rising prices, short Bitcoin positions have attracted an additional $11 million.

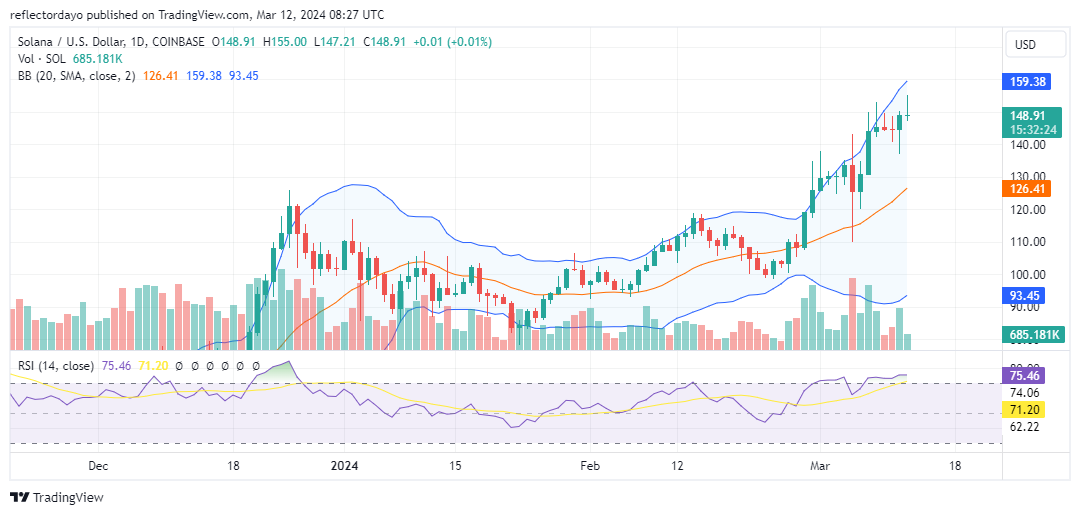
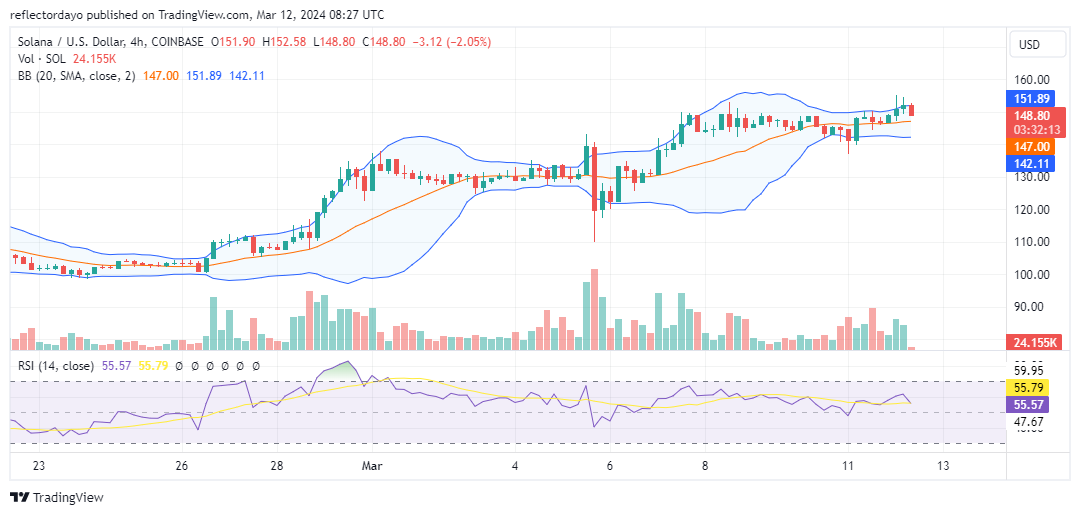
Solana, recovering from recent skepticism, has garnered $24 million in inflows. In contrast, Ethereum, despite solid year-to-date inflows, experienced slight outflows of $2.1 million. Other cryptocurrencies, such as Polkadot, Fantom, Chainlink, and Uniswap, also reported notable inflows ranging from $1.6 million to $2.7 million.

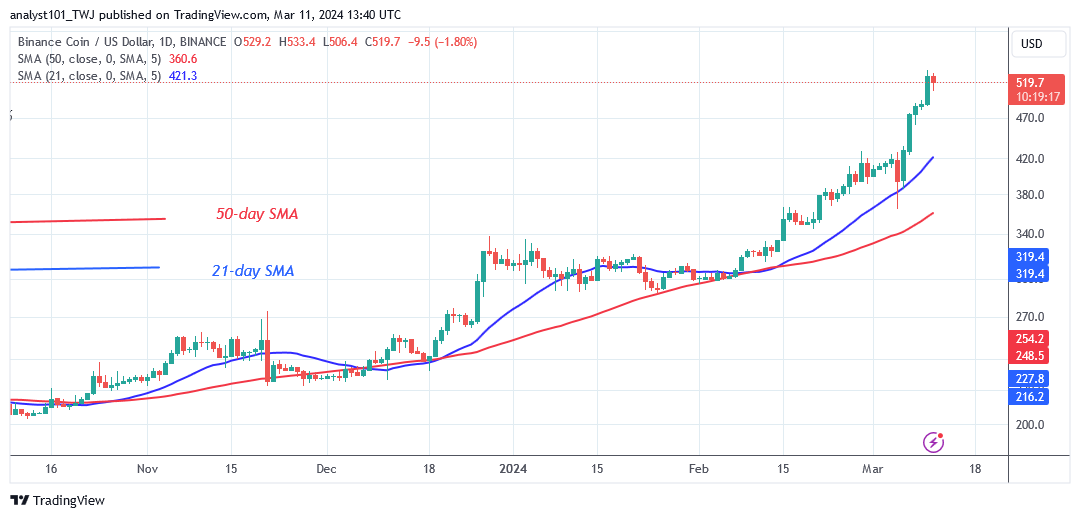
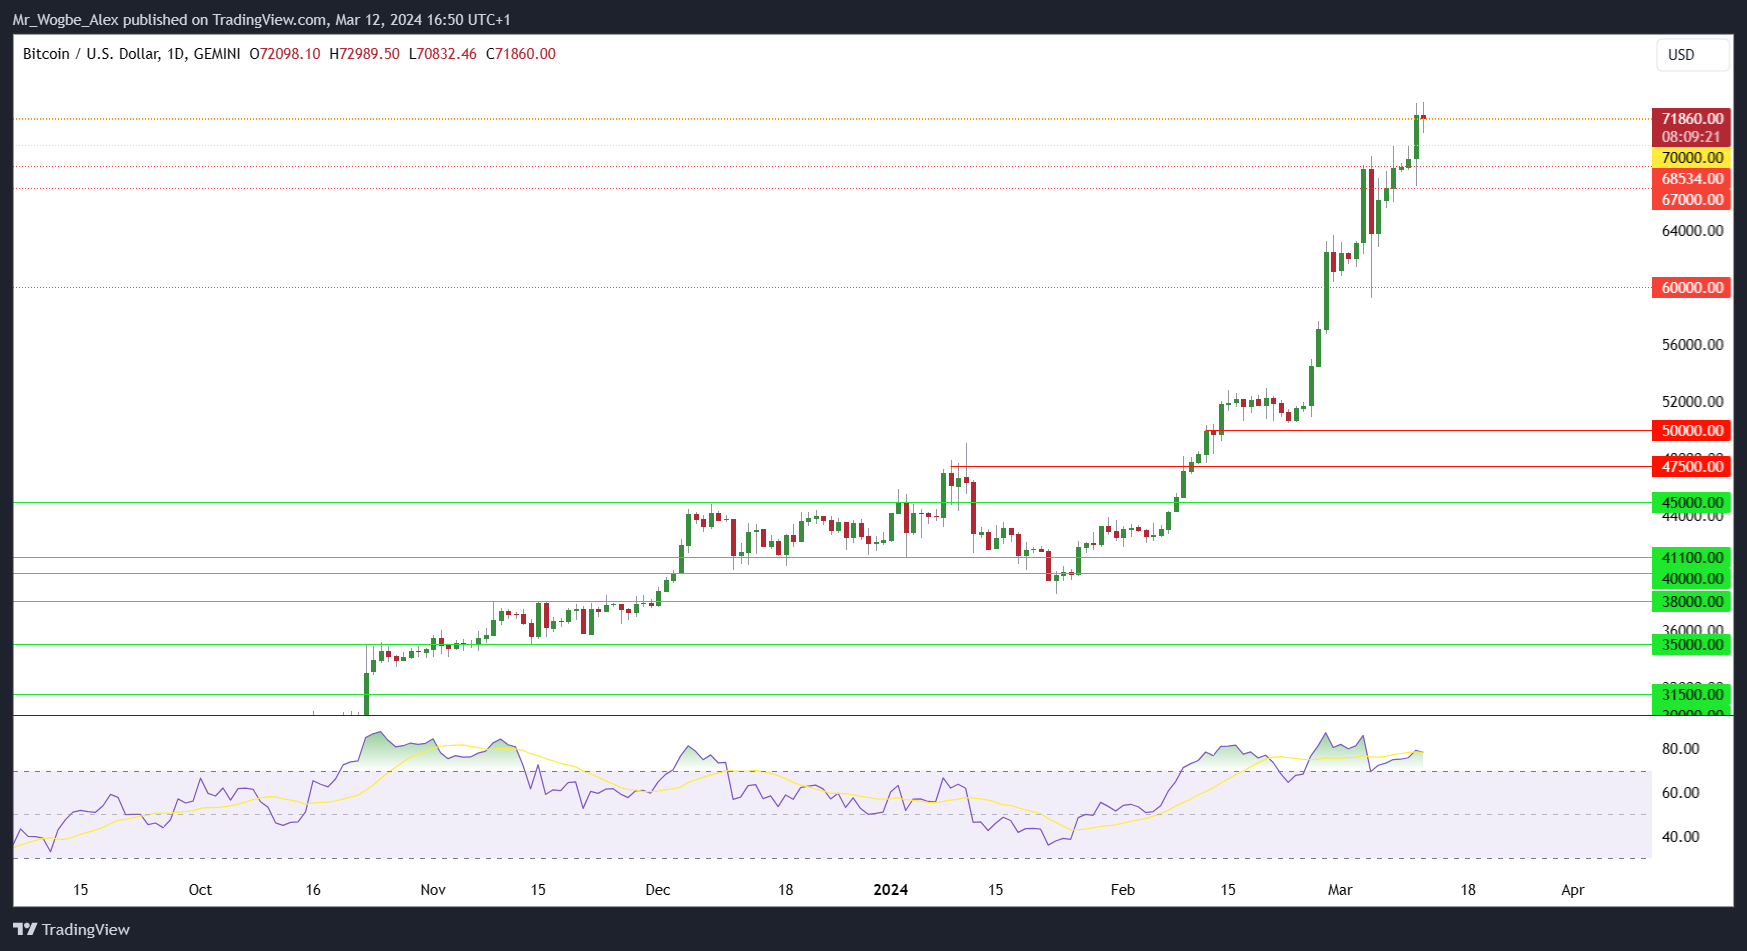
At the time of reporting, Bitcoin was trading at neutral levels around $72,000, with the total crypto valuation surpassing the $2.6 trillion mark. Blockchain equities, however, faced minor outflows totaling $2.5 million.

Crypto Inflows Surge, Nearing Annual Record: CoinShares Data
BTCUSD Daily Chart

When trading the crypto market, it doesn’t have to be “hit or miss.” Safeguard your portfolio with trades that actually yield results, just like our premium crypto signals on Telegram.


Interested in learning how to day trade crypto? Get all the information you need here

ApeCoin (APEUSD) Price Struggles to Advance

Market Analysis – ApeCoin Buyers Need a Boost

APEUSD price struggles to advance towards $2.400 significant level. The bulls, who represent the buyers in this market, have been exerting great effort to break through this key level. However, their attempts have been met with resistance, causing the price to struggle in its upward movement. 

APEUSD Key Levels

Resistance Levels: $2.460, $2.500
Support Levels: $2.150, $2.030

ApeCoin (APEUSD) Price Struggles to Advance

Since last week, the bulls have been encountering rejection as they try to push the price of APEUSD beyond the $2.400 level. This significant level has proven to be a formidable barrier, testing the strength and determination of the buyers. Despite their strong confidence and mobilized strength, the bulls have not been able to breach through this key level. 

It is worth noting that the buyers have shown resilience in the past month, successfully breaking through the $1.550 level and rising to the $2.400 market zone. This upward movement was accompanied by a break from the Bollinger band indicator, indicating a potential bullish trend. However, the current slowdown in price momentum has presented a challenge for the buyers.

Although the price of APEUSD is currently experiencing a slowdown, there are still opportunities for buyers to achieve a breakthrough. One such opportunity lies in the utilization of forex signals. These signals provide valuable insights and analysis of the market, helping traders make informed decisions even in irregular market conditions.

ApeCoin (APEUSD) Price Struggles to Advance

Market Expectation

Taking a closer look at the 4-hour chart, it is evident that the buyers are cooking up strength with the intention of recovering once again. Despite the rejection at the $2.150 significant level, the buyers have not lost hope. They are determined to force their way up this time and make a difference in the market. The 4-hour chart provides valuable insights into short-term price movements and trends.

You can purchase Lucky Block here. Buy LBLOCK

NoteCryptosignals.org is not a financial advisor. Do your research before investing your funds in any financial asset or presented product or event. We are not responsible for your investing results.

MANAUSD Sustains Bullish Momentum

Market Analysis: MANAUSD Upholds its Bullish Trajectory

MANAUSD continues to uphold its bullish trajectory, exhibiting consistent upward momentum in recent trading sessions. This sustained bullish trend is driving towards surpassing the supply levels situated at $0.8330.

Key Levels for MANAUSD

Demand Levels: $0.5370, $0.4000
Supply Levels: $0.7010, $0.8330

MANAUSD Sustains Bullish MomentumFollowing a bullish breakout in market structure, the price encountered a temporary pause upon reaching the $0.7011 supply level. Acting as a resistance point, this level prompted a minor decline in price. However, support at the $0.5369 level facilitated a reversal pattern formation in the 4-hour timeframe.

This reversal pattern has reignited bullish momentum, enabling the price to breach the $0.7011 supply level once again. Additionally, the Moving Average further corroborates the bullish sentiment, with the price positioned above its mark.

COINBASE:MANAUSD Chart Image by jereminze312

Market Expectations

Anticipation is high for the price to surpass the $0.8330 supply level, potentially establishing a new all-time high. However, following this upward surge, a pullback is widely expected as part of the market’s natural cycle.

You can purchase Lucky Block here. Buy LBLOCK

Note: Cryptosignals.org is not a financial advisor. Do your research before investing your funds in any financial asset or presented product or event. We are not responsible for your investing results.

Solana (SOL/USD) Market Hits Strong Bearish Frontline; Can Bulls Overcome the Resistance?

The Solana market is exhibiting early indications of a potential reversal. Since the start of March, there has been a pronounced upward trend, accompanied by heightened market volatility. This increased volatility is bolstering the bears’ strength around the $150 resistance level.

Solana Market Data

  • SOL/USD Price Now: $149
  • SOL/USD Market Cap: $66.5 billion
  • SOL/USD Circulating Supply: 443 million
  • SOL/USD Total Supply: 571 million
  • SOL/USD CoinMarketCap Ranking: #5

Solana (SOL/USD) Market Hits Strong Bearish Frontline; Can Bulls Overcome the Resistance?

Key Levels

  • Resistance: $150, $155, and $160.
  • Support: $140, $135, and $130.

Solana Market Analysis: The Indicators’ Point of View

The indicators suggest an imminent reversal of the current upward market trend. Firstly, today’s Solana crypto signal is characterized by a shooting star candlestick, featuring a long upper shadow and a shorter lower shadow. This pattern typically signals a trend reversal, particularly noteworthy as it appears at the apex of a bullish trend, around a key resistance level. The repeated testing of the $150 resistance level since March 7 has fortified its significance, with continued rejection bolstering its status as a formidable barrier. Furthermore, the RSI’s sideways movement subsequent to crossing the 70 level indicates a potential trend reversal.

Solana (SOL/USD) Market Hits Strong Bearish Frontline; Can Bulls Overcome the Resistance?

SOL/USD 4-Hour Chart Outlook

Upon analysis of the 4-hour chart for the Solana market, a pattern of consistent rejection is observed around the $150 price level. While there have been occasional excursions above $150, the majority of price action has remained below this threshold. This trend suggests a growing bearish sentiment, fueled by the market’s inability to sustain movement beyond $150. Should this bearish momentum persist, it is conceivable that bullish support may emerge around the $130 level. However, it is important to note that the current support level stands at $140, and a breach below this level could prompt further bearish activity unless bulls intervene at $130.

Trade crypto coins on BYBIT!

Dash 2 Trade Price Prediction for Today, March 12: D2TUSD Price to Break Up at $0.01232 Level

Dash 2 Trade Price Forecast: D2TUSD Price to Break Up at $0.01232 Level (March 12)
D2TUSD price may continue the new correction pattern to break up at the $0.01232 supply level soon to pave the way for a prolonged recovery trend. Buyers are actively defending at the moment, thus, a decisive break below $0.00644 would bring more losses to the coin. However, a daily candlestick above the mentioned supply level would invalidate any bearish theory. Therefore, if buyers can put more effort into their tension in the market, a shift in the trend upward to a $0.02000 upper high level will be achieved.

Key Levels:
Resistance levels: $0.00600, $0.00700, $0.00800
Support levels: $0.00450, $0.00300, $0.00250

D2T (USD) Long-term Trend: Bearish (4H)
Dash 2 Trade is bearish in its long-term outlook. The price responded to the shift in the market structure and is currently trading below the moving averages.
Dash 2 Trade Price Prediction for Today, March 12: D2TUSD Price to Break Up at $0.01232 Level
The cryptocurrency price has been below the supply trend levels since its most recent low due to the persistent bearish pressure over the last few hours. However, there is about to be a turnaround for the D2TUSD buy traders.

The sustained bearish pressure in the past few hours at the $0.00644 support value has made the crypto price remain below the supply trend levels in its recent price level.

At the time of writing, the coin is recovering from the recent correction as fresh buying emerges near the supply level following the upward race. The cryptocurrency has completed the low dips and is now set for a potential recovery rally.

The buy traders pushed the market price of Dash 2 Trade up to the $0.00658 resistance value slightly below the two EMAs shortly after the 4-hourly chart opens today. Thus, a break above the $0.01232 price level would intensify the buying pressure on the crypto.

Notably, the market price of D2TUSD is pointing up in the oversold region; this means that the momentum in the coin price will likely remain and continue in an upward move. We can now expect the next jump by the bulls to reach a $0.02000 upper resistance level in the days ahead in its higher time frame.

D2T (USD) Medium-term Trend: Bullish (1H)
Dash 2 Trade remains bullish on the medium-term time frames. This is clear as we can see the prices trading above the EMA-9. However, the market is presently facing resistance at the recent high.
Dash 2 Trade Price Prediction for Today, March 12: D2TUSD Price to Break Up at $0.01232 Level
The sustained bullish pressure pushed the currency pair up to the $0.00646 supply level during yesterday’s session and sustained it. This has made it possible for the coin to remain in an uptrend in its recent price level.

The bulls made an increase to the $0.00658 high mark above the EMA-9 shortly after the 1-hour session opened today. This indicates that the buy investors are dealing in the coin investment. Therefore, if the bulls could increase their tension in the market, the price of Dash 2 Trade will move above the key levels.

Meanwhile, further upsides are likely as the price signal is pointing upward, this means that the bullish rally will continue and may likely break the $0.01232 high mark which might hit the $0.02000 supply value in the coming days in the medium-term outlook.

Link Binance to your Dash 2 Trade account. See our easy, step-by-step instructions and cheat sheet.


Want a coin that has a huge potential for massive returns? That coin is Dash 2 Trade. Buy D2T now.

BNB Hits the $540 High and Begins a Sideways Slide

BNB (BNB) Long-Term Analysis: Bullish
BNB’s price breaks above the resistance at $460 and begins a sideways slide. The crypto asset has continued to grow, reaching a high of $538. However, purchasers were unable to extend their bullish momentum above the $540 high. The latest high has stymied further upward movement of the cryptocurrency. BNB will surge to $600 if buyers surpass the latest high.

In contrast, the altcoin will trade above the moving average lines but below the recent high, where resistance remains unbroken. BNB is valued at $525.59 as of this writing.

BNB Hits the $540 High and Begins a Sideways Slide
BNB/USD – Daily Chart

Technical indicators:
Major Resistance Levels – $440, $460, $480
Major Support Levels – $240, $220, $200

BNB (BNB) Indicator Analysis
The price bars are above the moving average lines, which slope northward. On the 4-hour chart, the price bars are near the 21-day SMA but below the $540 resistance level. Altcoin risks fall if the 21-day SMA is reached. The altcoin is trading in the overbought area of the market.

What Is the Next Direction for BNB (BNB)?
BNB has hit bullish exhaustion as it begins a sideways slide. The altcoin is trading in a close range between $500, the 21-day SMA support, and $540, the resistance level. As the altcoin trades in a narrow range, it is at risk of declining or breaking out. Currently, the crypto signal is favorable as the altcoin continues its upward ascent.

BNB Hits the $540 High and Begins a Sideways Slide
BNB/USD – 4-Hour Chart


You can purchase Lucky Block here. Buy LBLOCK


Note: Cryptosignals.org is not a financial advisor. Do your research before investing your funds in any financial asset or presented product or event. We are not responsible for your investing results

Evolve Markets Prepares for Shutdown

Evolve Markets wrote to users that after 7 years of providing stellar services to their loyal traders, they will be sunsetting their trading platform. They expressed understanding that this news might come as a surprise, but they assured users that their funds were not at risk.

They advised users who are currently actively trading to take note of the following important dates:
March 13th: The platform will transition to Close Only mode, meaning users will not be able to open new trades.
March 20th: Any open trades will be closed at market prices.

They kindly requested that all users initiate withdrawals of their funds before April 1st.
They also mentioned that if users encounter any difficulty in making the withdrawal by then, they should reach out to them via email at [email protected], and they would provide an alternative method for withdrawals beyond that date.

Evolve Markets Prepares for Shutdown

They assured users that the security of their funds was their top priority. Evolve Markets is well-capitalized and has sufficient funds to process all withdrawals. However, due to increased activity, processing times may exceed 24 hours. They appreciated users’ patience and understanding during this time.

Finally, they reminded users that their support remains available should they have any questions.

Evolve Markets is a financial trading platform for cryptocurrency and forex traders. Their fees are affordable, and they deliver top-notch services. They offer one of the largest varieties of cryptocurrency markets. The broker has good reviews from users as a testament to the kind of services they render to their users.

Trade crypto coins on BYBIT!

Bitcoin’s BRC-20 Token Standard Receives Significant Governance Overhaul

The evolution of BRC-20 governance unfolds as Domo’s Layer 1 Foundation partners with UniSat & Best in Slot to spearhead decentralized protocol leadership and innovation.

The BRC-20 token standard, famous as an enabler of the trading of digital assets beyond BTC on the platform, is going through a governance transition. This development occurs as Domo, the pseudonymous creator of the BRC-20 standard, and his non-profit organization, the Layer 1 Foundation (L1F), partner with major Bitcoin infrastructure companies, UniSat, and Best in Slot, as the leading maintainers of the protocol.

Collaborative Efforts for Advancement

The collaboration marks a significant milestone in the evolution of Bitcoin’s governance landscape, particularly concerning the BRC-20 token standard. Under Domo’s guidance, L1F has partnered with Unisat and Best in Slot, companies deeply ingrained in the Bitcoin ecosystem, to jointly oversee and govern the BRC-20 protocol.

Bitcoin's BRC-20 Token Standard Receives Significant Governance Overhaul

This alliance aims to establish the necessary infrastructure and services for the adoption of new standards within Bitcoin, fostering gradual growth alongside innovation.UniSat, renowned for its pioneering efforts in BRC-20 token listing and the development of the first BRC-20 indexer in collaboration with Domo, has been instrumental in the protocol’s ascent to a $5 billion market cap.

Best in Slot’s involvement in a decentralized BRC-20 indexing solution further strengthens the collective endeavor to mitigate centralization risks in the ecosystem. Consequently, the decentralized nature of the indexer becomes a pivotal aspect of the protocol’s governance and operational framework.

Governance and Supervision of BRC-20

In addition to appointing co-lead maintainers, Domo has established an oversight committee within the L1F framework to enhance the governance framework for the BRC-20 standard. Comprising five Ordinals companies—Hiro, Allium, ALEX, Oyl Dynamics, and UTXO Management—all integral stakeholders in the BRC-20’s ecosystem.

The committee is tasked with enforcing governance principles to ensure that market developments align with principles of fairness and market neutrality.

This governance enhancement is underscored by the establishment of the Layer 1 Foundation as a 501(c)(6) non-profit entity. L1F extends its mission beyond BRC, aiming to foster the growth of metaprotocols on the Bitcoin network.

Through the provision of educational resources and development tools, L1F seeks to drive innovation within Bitcoin-native ecosystems, emphasizing a market-neutral approach to support.

In order to place winning trades with us via Bybit, You can open an account here.

Dogecoin (DOGE/USD) Trade Tends a Retracement, Holding Above $0.14

Dogecoin Price Prediction – March 11

As there has been a significant reversal downward move from around the point of $0.20, it produced a crypto signal to denote that buyers are liable to not have smooth outward-upside breaking through of resistances, given that the crypto trade tends a retracement moving style, holding above the point of $0.14.

It would be psychologically ideal for long-position placers to be strategically approaching in their way of placing position orders. According to that hypothesis, several false pulldowns that couple with fast upward reversal crypto signals may result in steady upward pressures in the long-term running mode.

DOGE/USD Market
Key Levels:
Resistance levels: $0.20, $0.30, $0.40
Support levels: $0.14, $0.12, $0.10

DOGE/USD – Daily Chart
The DOGE/USD daily showcases that the crypto instrument tends to retrace, holding above the baseline of $0.14.

The stochastic oscillators are over a couple of times, positioning southerly to move closely to the line of 20. Taking a look at the indicators from the middle Bollinger Band shows that the critical baseline is going to be centered around the line of $0.14.
Dogecoin (DOGE/USD) Trade Tends a Retracement, Holding Above $0.14

Is it possible that purchasers in the DOGE/USD market are unaware that the upper Bollinger Band is forming a shield above the price at the $0.20 mark?

A formation of a shielding outlook of the upper Bollinger Band indicator at a higher resistance spot like $0.20 will signify that price is going to relax for a while, blowing the point, given that the DOGE/USD market tends to retrace, holding above $0.14.

The market’s bulls will probably push back against any downward suspending moves that come from or above the middle Bollinger Band. Should the aforementioned situation come to pass, buyers will need to strengthen their comeback strategy.

Some pull-ups will be permitted to be paired with a signal of turning down that has to play out before launching a short-position order with the notion of exciting a stop-loss order in order to make sure that short-position pushers are on the safer side. Achieving that sentiment will take a lot of work because cryptocurrency economies are currently experiencing a bullish cycle.
Dogecoin (DOGE/USD) Trade Tends a Retracement, Holding Above $0.14
DOGE/BTC Price Analysis
In contrast, the Dogecoin market tends to retrace against the stance of Bitcoin, holding above the middle Bollinger Band indicator.

Using a pattern of movement, the stochastic oscillators have demonstrated that significant rejections of price actions have begun to occur at a specific higher resistance zone. With ideal bearish candlesticks, the upper Bollinger Band trend lines are attempting to bend southward, indicating that pushers in long positions should exercise caution. Most indications that the price will enter a long-term, free-driven downward path will be invalidated if the oscillators are repositioned at lower ends to the upside.

Note: Cryptosignals.org is not a financial advisor. Do your research before investing your funds in any financial asset or presented product or event. We are not responsible for your investing results.


You can purchase Lucky Block here. Buy LBLOCK