Binance Coin Fluctuates Above the $360 Support as Bears Threaten To Short
Estimated Reading Time: 2 minutes
Don’t invest unless you’re prepared to lose all the money you invest. This is a high-risk investment and you are unlikely to be protected if something goes wrong. Take 2 minutes to learn more

Free Crypto Signals Channel

Binance Coin (BNB) Long-Term Analysis: Bearish
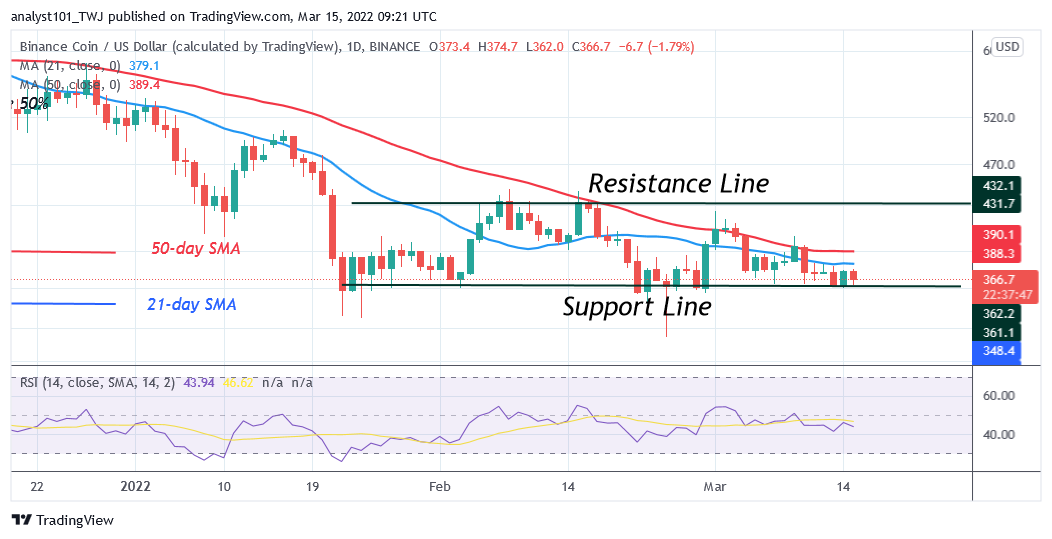
Binance Coin’s (BNB) price is in a downward correction as bears threaten to short. On March 9, buyers attempt to push the crypto above the moving averages but were repelled. Since March 9, the altcoin has been in a downward move. In the previous price action, the bulls have failed to break above the moving averages, hence the downward correction. Today, BNB/USD has been trading at $366 at the time of writing. Since January 22, the cryptocurrency has been fluctuating between $360 and $430 price levels. The bulls have succeeded to defend the current support but fail to break above the moving averages. On the downside, BNB will decline to $320 low if the current support is breached.
Binance Coin (BNB) Indicator Analysis
BNB/USD has fallen to level 46 of the Relative Strength Index period 14. The altcoin is in the downtrend zone and below the centerline 50. The crypto’s price is below the moving averages indicating a possible fall. BNB is above the 30% range of the daily stochastic. Binance Coin is in a range-bound move.
Technical indicators:
Major Resistance Levels – $640, $660, $680
Major Support Levels – $540, $520, $500
What Is the Next Direction for Binance Coin (BNB)?
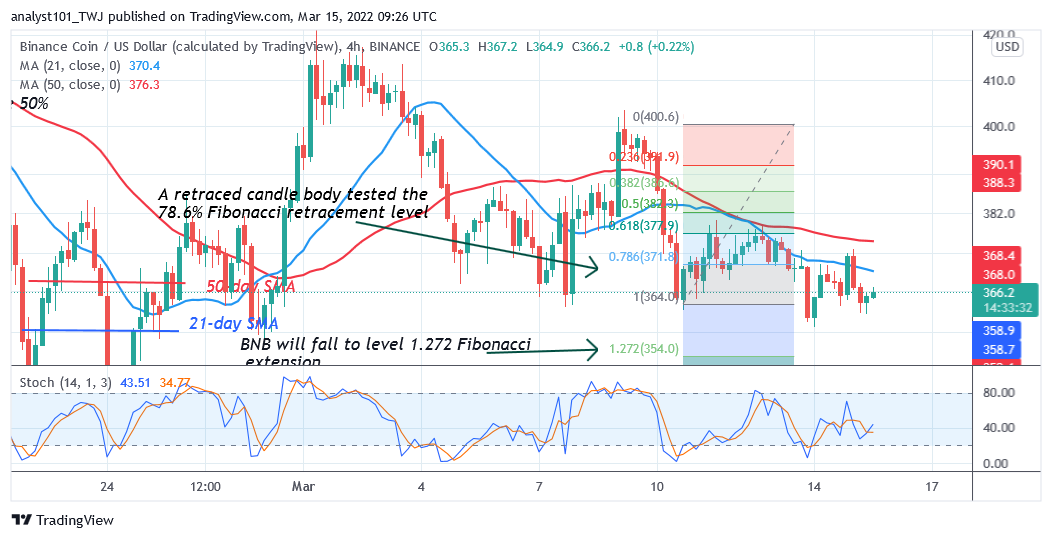
On the 4 hour chart, Binance Coin is in a downtrend as bears threaten to short. Meanwhile, on March 10 downtrend; a retraced candle body tested the 78.6% Fibonacci retracement level. The retracement suggests that BNB will fall to level 1.272 Fibonacci extension or $354. From the price action, the crypto reached the low of $360 and reversed.
You can purchase crypto coins here. Buy LBLOCK
Note: Cryptosignals.org is not a financial advisor. Do your research before investing your funds in any financial asset or presented product or event. We are not responsible for your investing results