IoTeX (IOTX/USD): Bulls Stall Bearish Momentum at $0.0239
Estimated Reading Time: 2 minutes
Don’t invest unless you’re prepared to lose all the money you invest. This is a high-risk investment and you are unlikely to be protected if something goes wrong. Take 2 minutes to learn more

The broader cryptocurrency market is currently weighed down by strong bearish sentiment, with most assets trending lower. However, in the case of IoTeX, bullish traders have managed to halt the downside pressure around the $0.0239 level — a key zone where price action is now consolidating. This standoff suggests a gridlock between buyers and sellers, raising the possibility of an imminent breakout.
IoTeX (IOTX/USD) Market Data
- IOTX/USD Price Now: $0.0239
- IOTX/USD Market Cap: $227 million
- IOTX/USD Circulating Supply: 9.44 billion IOTX
- IOTX/USD Total Supply: 9.44 billion IOTX
- IOTX/USD CoinMarketCap Ranking: #187
Key Levels to Watch
- Resistance: $0.025, $0.026, $0.027
- Support: $0.022, $0.021, $0.020
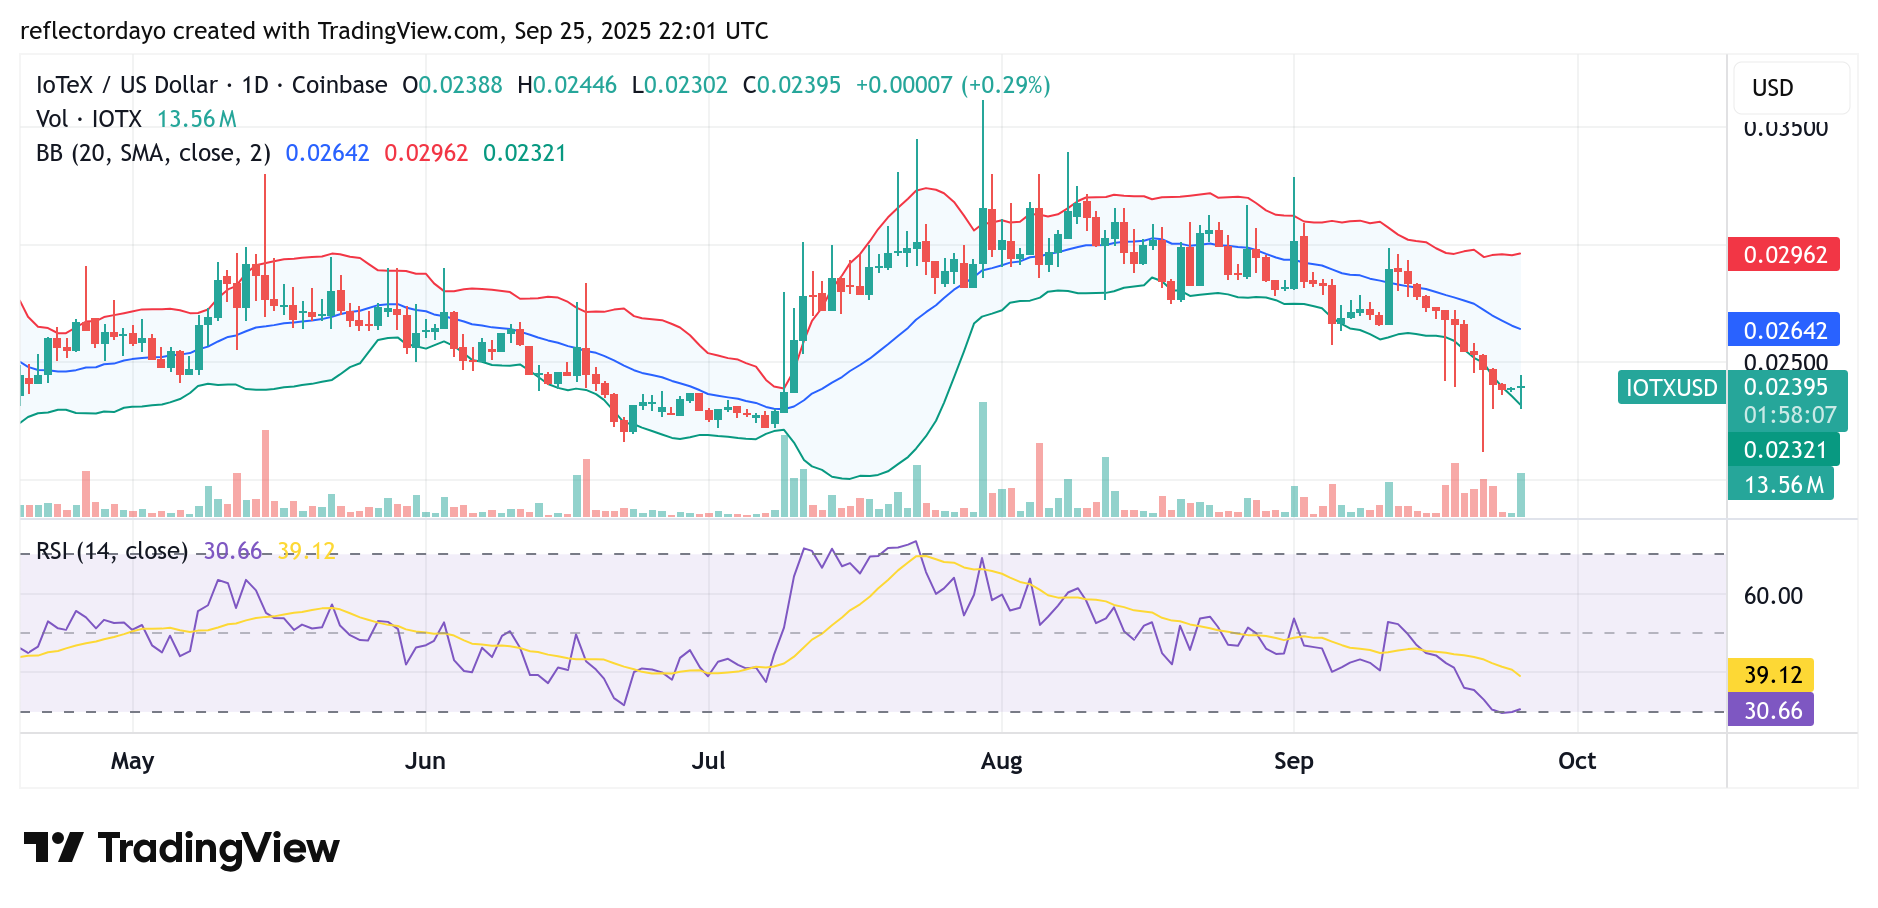
IoTeX (IOTX/USD) Daily Chart Outlook
The IoTeX market currently shows signs of gridlock at lower price levels, which could be an early indication of a potential rebound. The trading volume histogram accompanying the long-legged doji is particularly significant. It reflects intense buying and selling pressure within the same session, yet neither side was able to establish clear control. Since this activity is occurring near the market lows, it suggests that bearish momentum may be weakening.
Additionally, recent bearish moves have led to heightened volatility, which often precedes sharp price reversals. Therefore, a notable rebound to the upside appears likely. However, if the crypto signal continues to consolidate around this level, volatility could gradually diminish, leading to a more stable trading environment.
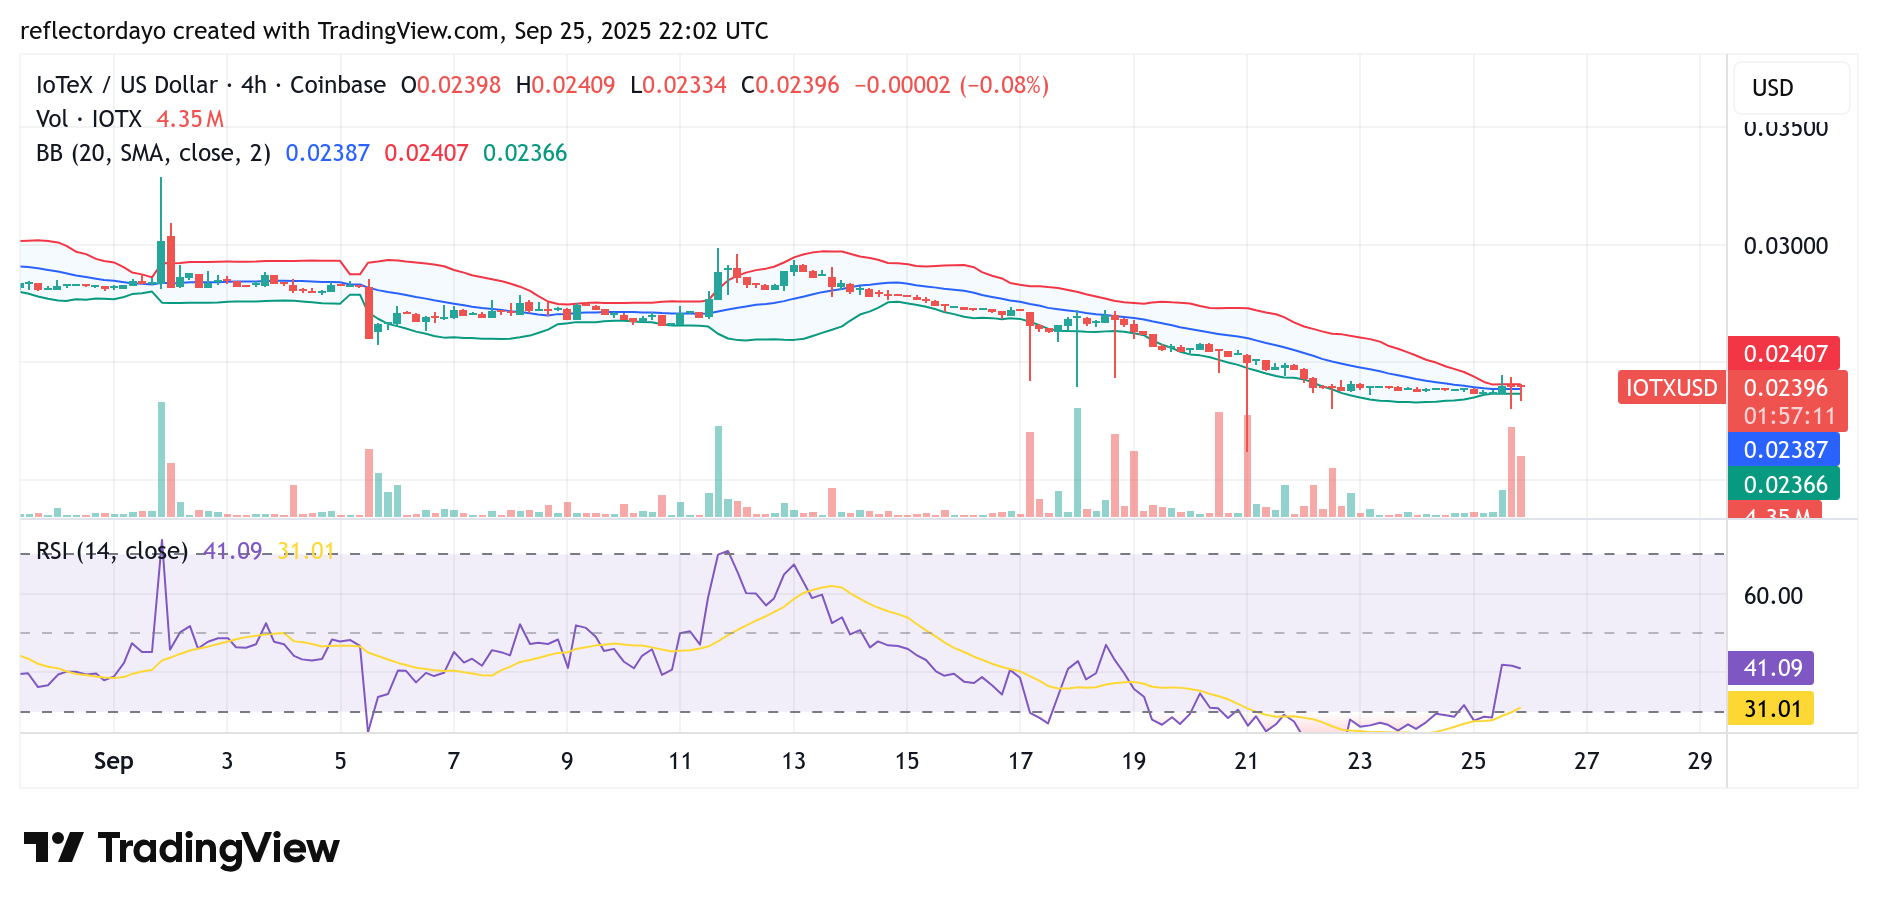
IOTX/USD 4-Hour Chart Outlook
Over the last three 4-hour sessions, the market has shown notable activity, as reflected in the trading volume histograms. These spikes highlight a sudden surge and clash in investor interest, though neither demand nor supply has been able to establish clear dominance.
Meanwhile, the Bollinger Bands are beginning to converge, signaling a volatility squeeze. Such a setup often precedes a significant directional move. Given that this development is unfolding at lower price levels, the likelihood leans toward a potential rebound.