Solana (SOL) Price Prediction: SOL/USDT Generally Stays on Track Toward the $120 Threshold
Estimated Reading Time: 2 minutes
Don’t invest unless you’re prepared to lose all the money you invest. This is a high-risk investment and you are unlikely to be protected if something goes wrong. Take 2 minutes to learn more

Date: December 26, 2025
The Solana market hasn’t really changed its course from what was noted in the previous analysis. However, it has advanced further toward the more psychological support at the $120 price level, as previously highlighted.
Long-Term Trend—Bearish (Daily Chart)
Key Price Levels:
Resistance: $125, $130, $135
Support: $120, $115, $110
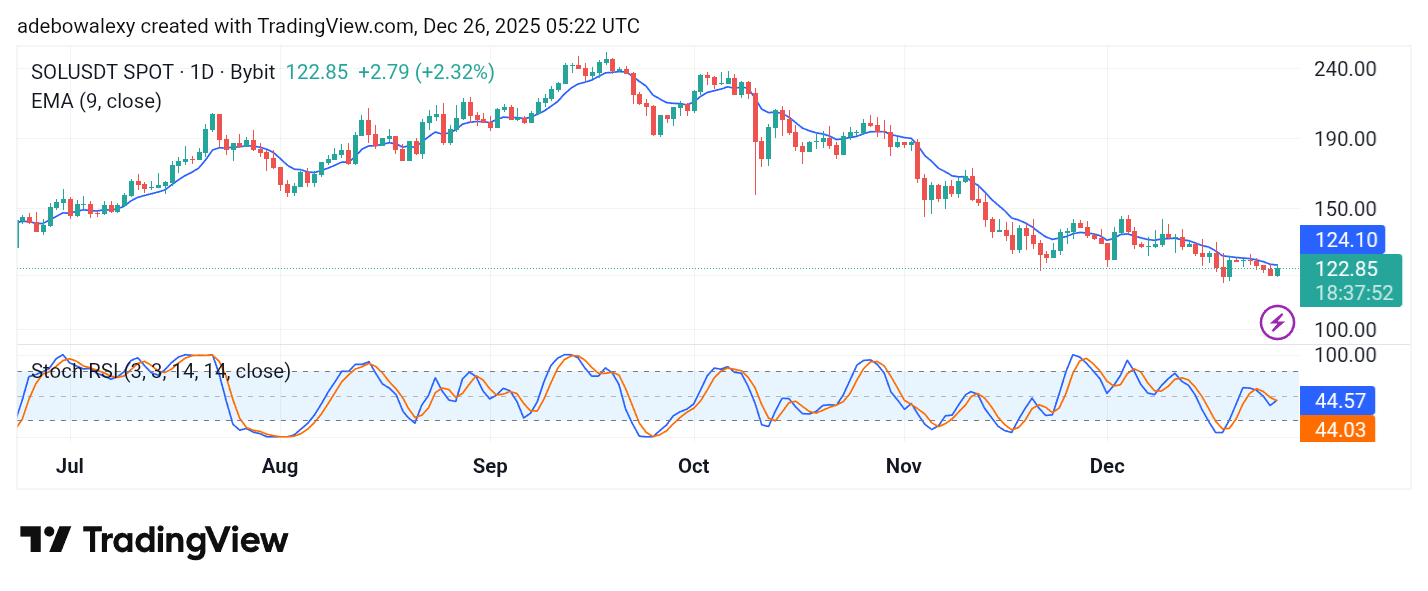
While the corresponding price candle for the ongoing session has appeared green, indicating that the market has rebounded upward, trading nevertheless remains below the 9-day Exponential Moving Average (EMA) line. At the same time, the Stochastic Relative Strength Index (SRSI) indicator lines can be seen converging for an upside crossover. This crossover has just occurred below the 50 threshold level of the indicator.
Solana (SOL) Price Prediction: SOL/USDT Keeps Slipping
The Solana market has continued to descend into lower price levels. Be that as it may, the last price candle on this chart has appeared green and has pushed the market slightly upward. However, this move only keeps the market testing resistance at the 9-day EMA curve.
Meanwhile, the lines of the SRSI indicator are now converging for an upward crossover just below the 50 level of the indicator. Despite this, price action in this market still maintains a downward trajectory toward lower price levels.
Solana (SOL) Price Prediction: SOL/USDT Buyers Are Trying to Cause a Shift (4-Hour Chart)
Price movement in the Solana 4-hour market appears tilted toward attempting to break free from bearish pressure. The latest price candle on this chart is green and sits directly above the 9-day EMA curve.
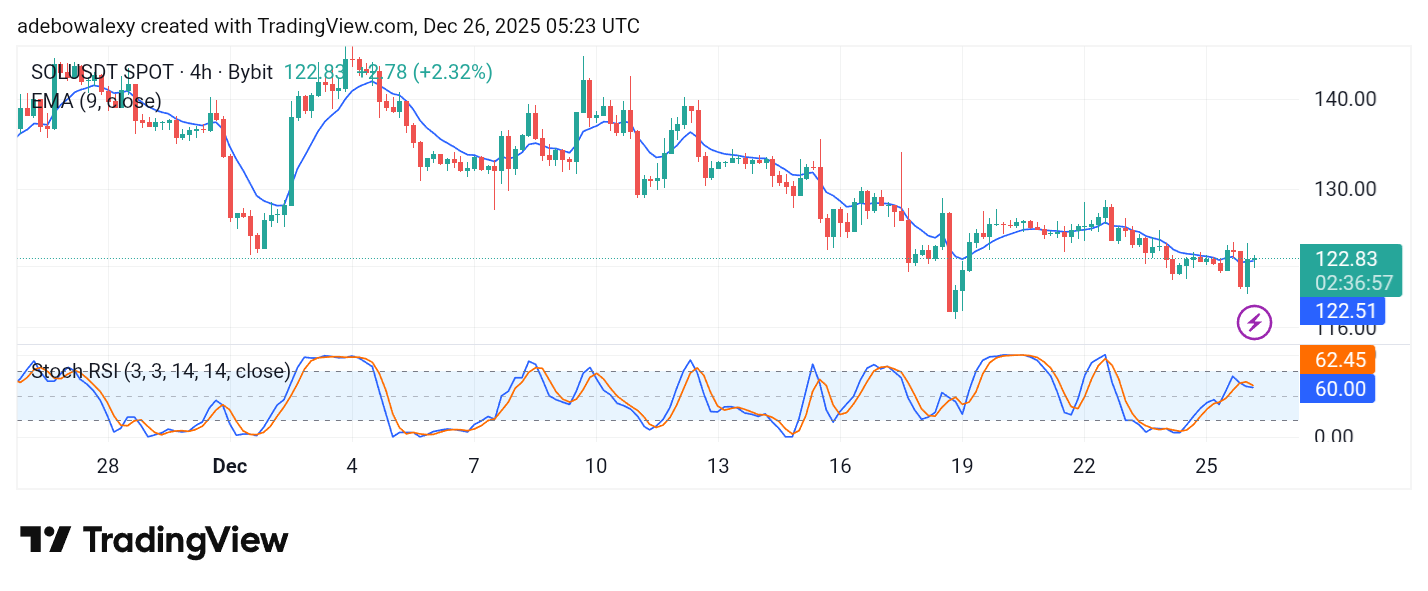
Meanwhile, the lines of the SRSI indicator are above the 60 threshold but have a slight downward trajectory. Nevertheless, the behavior of the SRSI lines suggests a potential tilt toward a trend reversal.
While this market may be leaning toward an upside path, the move could be short-lived, as price action may still proceed toward the $120 price level.