Bitcoin (BTC/USD) Price Precipitates Close to $20,000
Estimated Reading Time: 3 minutes
Don’t invest unless you’re prepared to lose all the money you invest. This is a high-risk investment and you are unlikely to be protected if something goes wrong. Take 2 minutes to learn more

Free Crypto Signals Channel
Bitcoin Price Prediction – August 24
What is obtainable now is that the BTC/USD market price precipitates close to the $20,000 line. The last several hours into today’s session have witnessed low-active motions between $21,559.72 and $21,159.96 value lines at a minute negative percentage rate of 0.90.
BTC/USD Market
Key Levels:
Resistance levels: $25,000, $27,500, $30,000
Support levels: $20,000, $17,500, $15,000
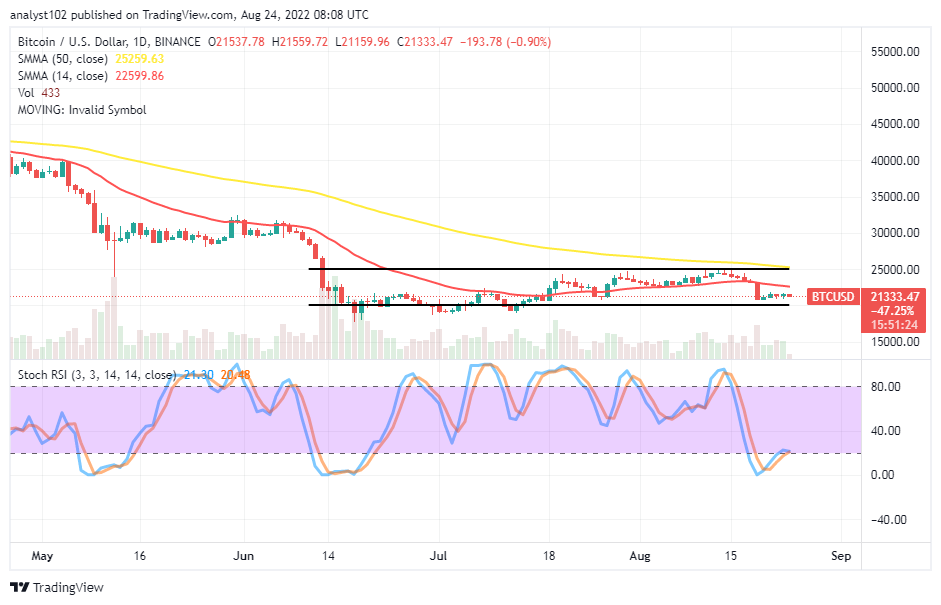
BTC/USD – Daily Chart
The daily chart portrays the BTC/USD crypto-economic price precipitates close to $20,000 after the emergence of a bearish candlestick on the 19th day of this month. Presently, the 50-day SMA indicator is at $25,259.63 above the $22,599.86 value line of the 14-day SMA indicator. The range-bound zones remain marked by the upper and the lower horizontal lines drawn at each end of the first resistance and the first support levels as given above. The Stochastic Oscillators have initially touched a dipper point in the oversold region to now position at the 24.30 and 20.48 range points within.
On what condition the BTC/USD market can stay below the critical $20,000 support level?
A sudden breakdown force has to occur against the BTC/USD market psychological line at $20,000 to stay underneath it as the crypto’s price precipitates close to the value line in question. There may be a prolongation of the current trading outlook to create other rounds of ranging movements to cause indecisions for traders of all directions. Long-position placers may have to be on the alert to get a rebound from around the lower-trading zone.
On the downside of the technical analysis, sellers have to be wary of a bouncing-off move that can breach past the $22,599.86 value line of the 14-day SMA. A fearful push against the $20,000 psychological support level will closely average a lower point near the $17,500. Shorting orders may launch while spotting active motions to the downside with the principles of adhering to proper money management.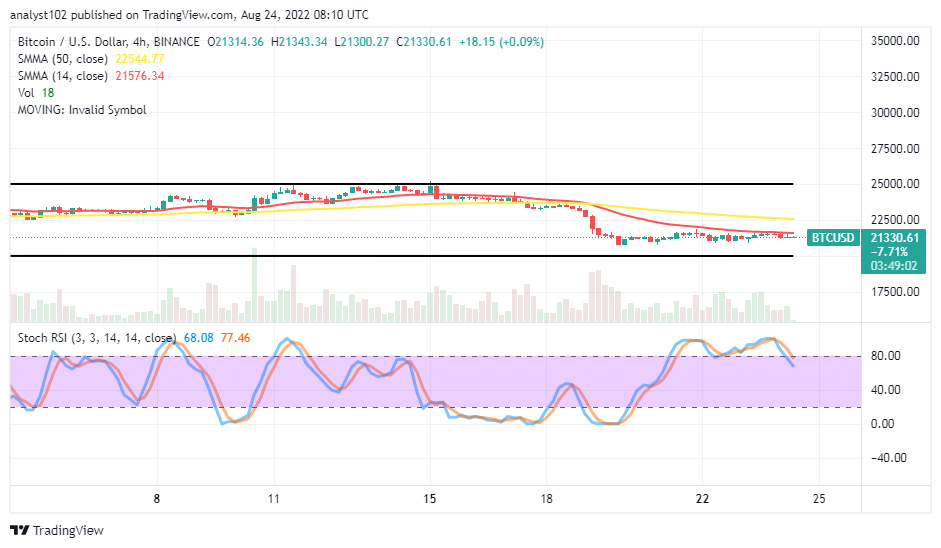
BTC/USD 4-hour Chart
The BTC/USD medium-term chart showcases the crypto’s price precipitates close to the $20,000 support level. The 14-day SMA indicator is at $21,576.34 beneath the $22,544.77 value point of the 50-day SMA indicator. Variant smaller lengths of candlesticks denoting a line of ranging movements that have taken place between the smaller SMA and the lower range line drawn at the $20,000 support level. The Stochastic Oscillators have partially crossed southbound from the overbought region to position at 77.46 and 68.08 range values. It shows that the market may need to build up over time to find reliable support at a lower-trading zone before another round of upswings.
Note: Cryptosignals.org is not a financial advisor. Do your research before investing your funds in any financial asset or presented product or event. We are not responsible for your investing results.
You can purchase Lucky Block here. Buy LBLOCK