Bitcoin Price Prediction: BTC/USD Retraces Below $30k
Don’t invest unless you’re prepared to lose all the money you invest. This is a high-risk investment and you are unlikely to be protected if something goes wrong. Take 2 minutes to learn more
Bitcoin Price Prediction – July 24
The Bitcoin price indicates bearish momentum as further upside has been rejected since yesterday, and bullish momentum has been lost.
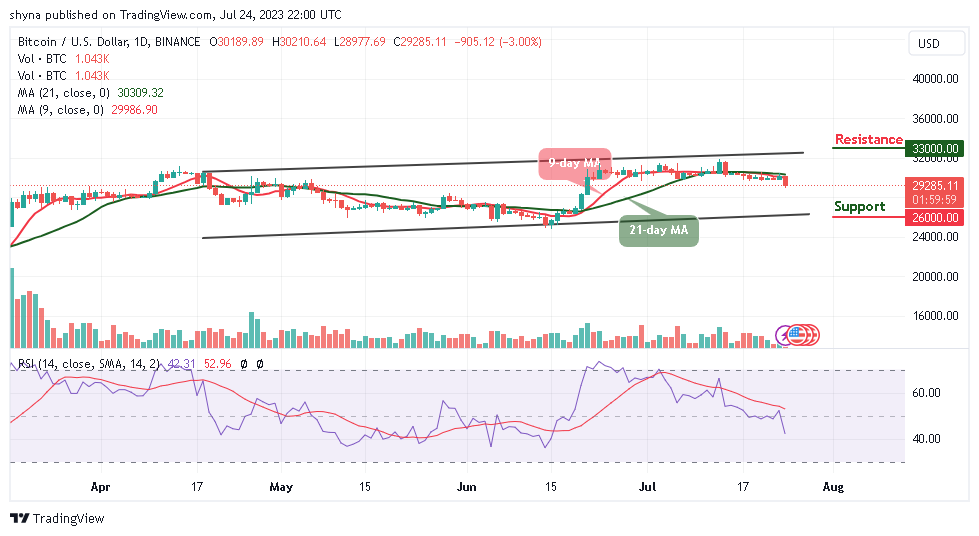
BTC/USD Long-term Trend: Ranging (Daily Chart)
Key levels:
Resistance Levels: $33,000, $34,000, $35,000
Support Levels: $26,000, $25,000, $24,000
BTC/USD is currently hovering at $29,285 as the king coin retreats below the 9-day and 21-day moving averages. At the time of writing, the path of least resistance is downwards, and the daily chart shows that the formation of a bearish may come to play.
Bitcoin Price Prediction: BTC Price May Retreat to Regain the Upside
At the time of writing, the technical indicator Relative Strength Index (14) is heading toward the south. As Bitcoin price faces the south, the Relative Strength Index (14) is likely to cross below the 40 level to confirm the bearish movement. However, if the coin spikes above the moving averages, this could mean that there may still be room that could be explored by the bulls.
Meanwhile, the daily chart reveals that the recovery may not come easy as the support will have to be sorted for above the moving averages. Therefore, a sustainable move toward the upper boundary of the channel could be located at $32,000, which may allow for an extended recovery toward the resistance levels at $33,000, $34,000, and $35,000. However, an increase in selling pressure could force the Bitcoin price toward the supports at $26,000, $25,000, and $24,000.
BTC/USD Medium-term Trend: Ranging (4H Chart)
On the 4-hour chart, the Bitcoin price is seen trading below the 9-day and 21-day moving averages. BTC/USD could survive the $29,000 support if the bulls return to the market and a break above the moving averages may create more gains for the coin.
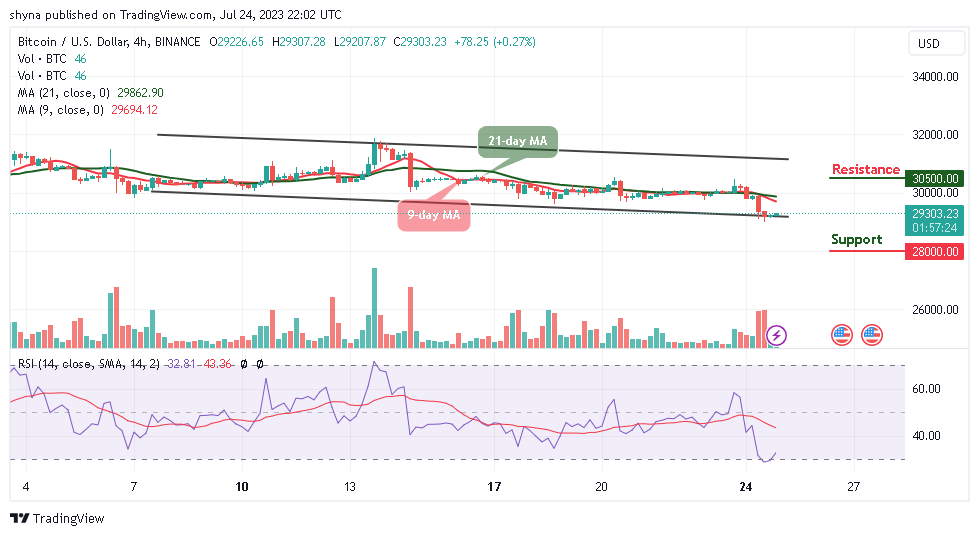
On that note, higher resistance could be located at $30,500 and above, and as the technical indicator, Relative Strength Index (14) could move to cross above the 40-level. On the other hand, if the bearish movement continues, the support level of $28,000 and below could be reached and the king coin may cross below the lower boundary of the channel.
You can purchase Bitcoin here. Buy BTC