Bitcoin Breaks Parabolic Rally Following US Inflation Numbers
Estimated Reading Time: 3 minutes
Don’t invest unless you’re prepared to lose all the money you invest. This is a high-risk investment and you are unlikely to be protected if something goes wrong. Take 2 minutes to learn more

Free Crypto Signals Channel
A few minutes after the CPI data got published, Bitcoin shed most of the gains recorded this week, falling to the $21.3K axis. At press time, the benchmark cryptocurrency trades at $21,360 after dropping by 5.5% within the last hour. Regardless, the benchmark cryptocurrency remains up at 6.63% in September.
Traditional financial assets suffered the same fate, with the Nasdaq 100, S&P 500, and Dow Jones falling by an average of 2%.
The Consumer Price Index is a measure of the cost of various goods and services, such as a gallon of milk and used cars. Economists use CPI data to evaluate inflation levels in the underlying economy. Recently, CPI data has shown that the US is battling some of the worst inflation recorded in over four decades.
Today’s CPI data showed that the CPI increased by 0.1% in August, bringing inflation to 8.3% and overshooting economists’ expectations of 8.1%. While this seems like a minor and inconsequential increase, it is likely the US Fed will take it as a signal to maintain its aggressive quantitative tightening policy, which is a bearish signal for Bitcoin and the crypto market.
Key Bitcoin Levels to Watch — September 13
The recent bullish spike by BTC seems to be getting undone on Tuesday after higher-than-expected CPI data sent risk-related assets on a southward move.
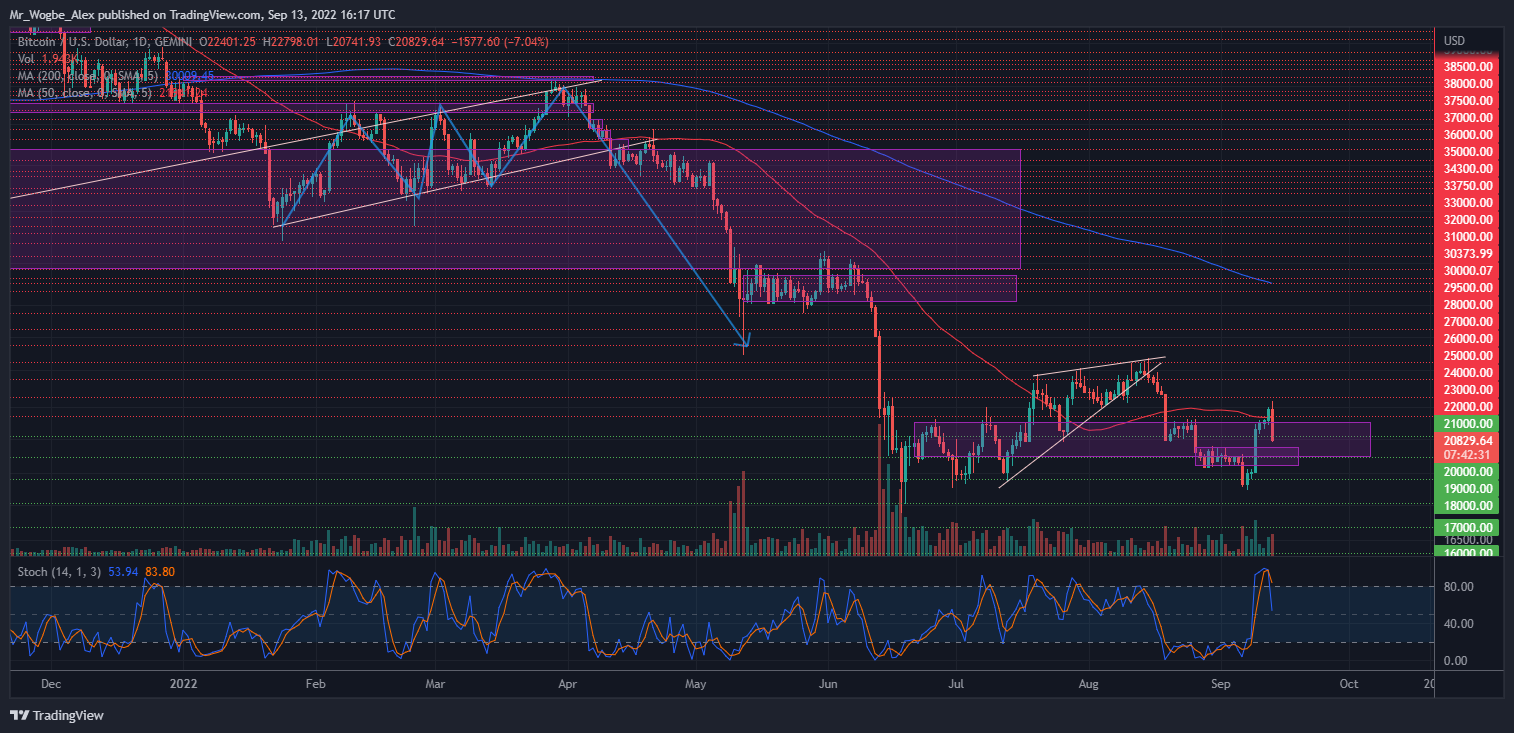
The benchmark cryptocurrency, which was on track to reclaim the $23K mark for the first time since August 19, now struggles to retain the $21K support.
That said, BTC would need to catch itself soon and position itself for a possible bullish rally from the Ethereum Merge event. In the meantime, I do not see a sustained decline past the $20K support.
Meanwhile, my resistance levels are at $21,000, $22,000, and $23,000, and my key support levels are at $20,500, $19,000, and $19,500.
Total Market Capitalization: $1.01 trillion
Bitcoin Market Capitalization: $398.8 billion
Bitcoin Dominance: 39.5%
Market Rank: #1
You can purchase Lucky Block here. Buy LBLOCK