Chainlink Declines and Holds above $14.94, May Slide to $12 Low
Estimated Reading Time: 3 minutes
Don’t invest unless you’re prepared to lose all the money you invest. This is a high-risk investment and you are unlikely to be protected if something goes wrong. Take 2 minutes to learn more

Free Crypto Signals Channel
Chainlink (LINK) Long-Term Analysis: Bearish
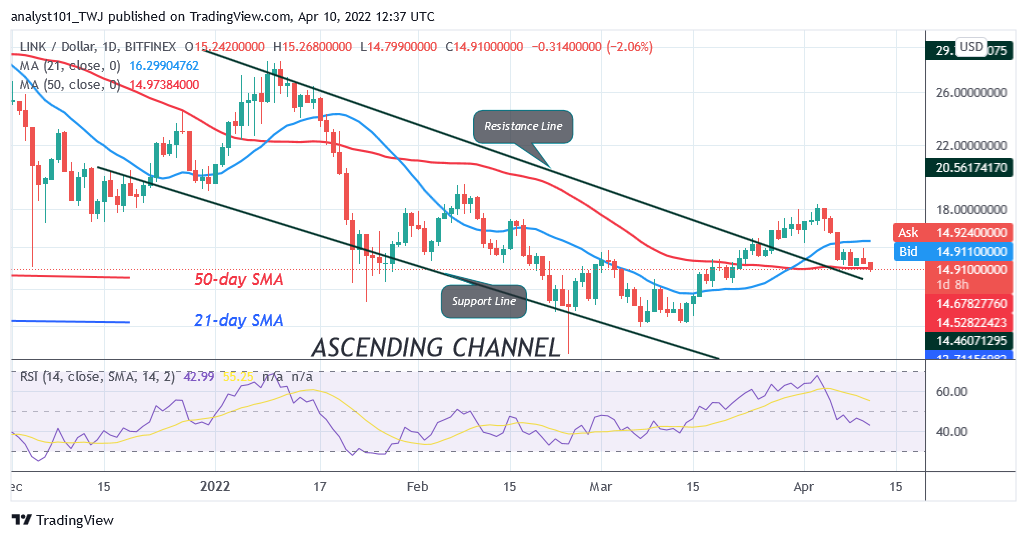
Chainlink’s (LINK) price has fallen below the moving averages as it may slide to $12 low. The cryptocurrency fell in between the moving averages. It is above the 50-day line SMA but below the 21-day line SMA. The altcoin will commence a range-bound move if it holds above the 50-day line SMA. On the other hand, the selling pressure will continue if price breaks below the 50-day line SMA. LINK will trend when the moving average lines are breached. For instance, if the bulls break above the 21-day line SMA, Chainlink will retest or rally above the $18 high. In the same vein, the altcoin will further decline, if the bears break below the 50-day line SMA. That is, Chainlink will further decline to the low of $12.
Chainlink (LINK) Indicator Analysis
The crypto’s price bars are between the moving averages indicating a possible range bound movement of the cryptocurrency. The market has fallen to level 42 of the Relative Strength Index for period 14. It is trading in the downtrend zone and capable of falling. . The altcoin is below the 20% range of the daily stochastic. It has fallen to an oversold region of the market. The selling pressure is likely to subside.
Technical indicators:
Major Resistance Levels – $40.00, $42.00, $44.00
Major Support Levels – $26.00, $24.00, $22.00
What Is the Next Direction for Chainlink (LINK)?
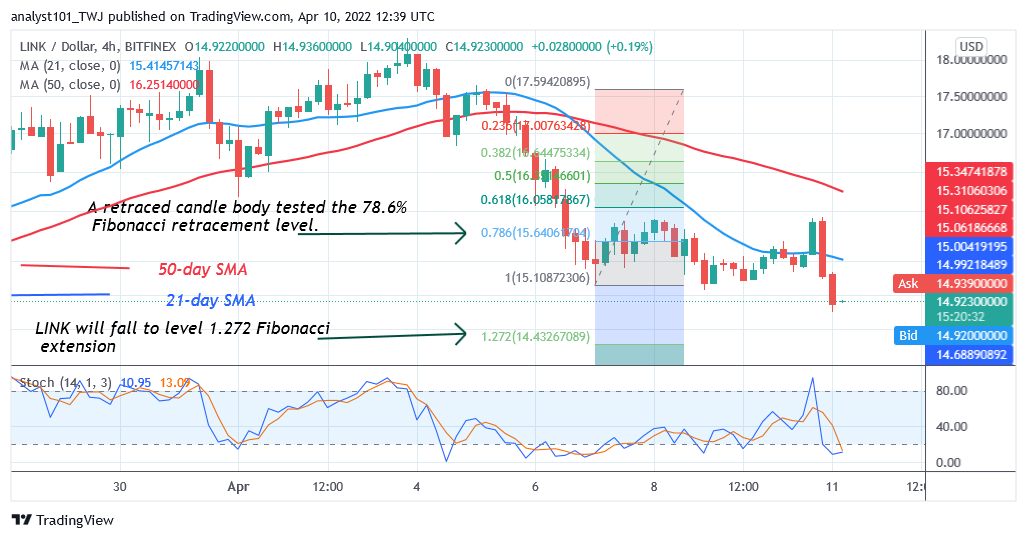
Chainlink’s selling pressure has reached bearish exhaustion as it may slide to $12 low. Meanwhile, on April 7 downward, a retraced candle body tested the 78.6% Fibonacci retracement level. The retracement indicates that LINK will fall to level 1.272 Fibonacci extension or $14.43. From the price action, Chainlink is reversing above the $15 support.
You can purchase crypto coins here. Buy LBlock
Note: Cryptosignals.org is not a financial advisor. Do your research before investing your funds in any financial asset or presented product or event. We are not responsible for your investing results