Quant Price Prediction: QNT/USD Gets Ready to Press Higher
Estimated Reading Time: 2 minutes
Don’t invest unless you’re prepared to lose all the money you invest. This is a high-risk investment and you are unlikely to be protected if something goes wrong. Take 2 minutes to learn more
Quant Price Prediction – June 9
The Quant price prediction shows that QNT would begin to form higher as the coin prepares to follow the bullish movement.
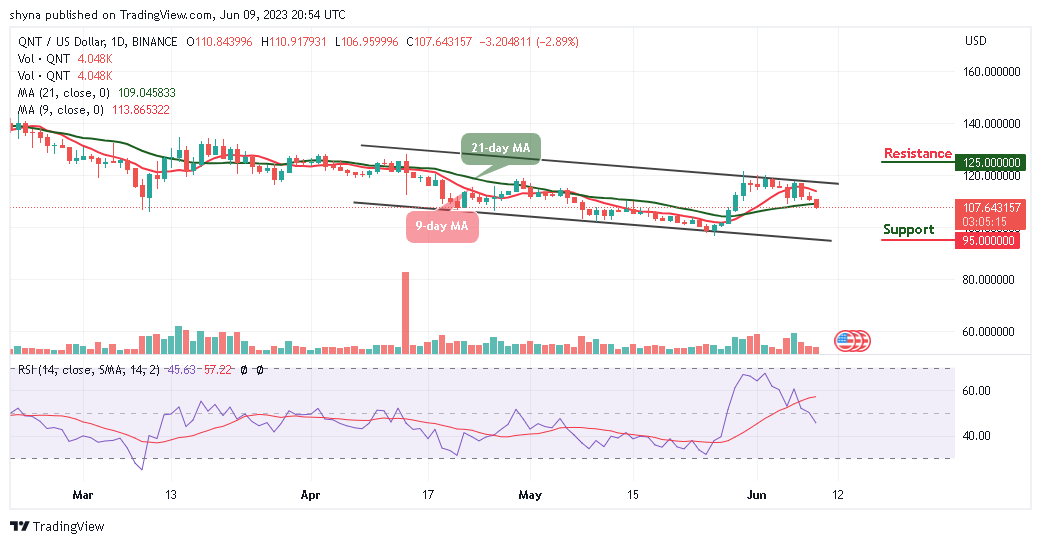
QNT/USD Long-term Trend: Ranging (1D Chart)
Key Levels:
Resistance levels: $125, $135, $145
Support levels: $95, $85, $75
QNT/USD is crossing below the 9-day and 21-day moving averages as the coin prepares for the bullish movement toward the upside. The Quant price is exchanging hands at $107.6 and it could head toward the lower boundary of the channel to allow new investors to come into focus.
Quant Price Prediction: QNT/USD Will Break to the Upside
The Quant price would begin to rise and break above the 9-day and 21-day moving averages if the bulls can defend the $105 support level. However, as the coin begins to head to the upside, it could hit the potential resistance levels of $125, $135, and $145.
Meanwhile, this technical analysis may not play out if the sellers increase the selling pressure, crossing below the lower boundary of the channel will hit the support levels of $95, $85, and $75. However, the technical indicator Relative Strength Index (14) is crossing below the 50-level to prepare the coin for the bullish movement.
QNT/USD Medium-term Trend: Ranging (4H Chart)
Looking at the 4-hour chart, the Quant price would move up higher if the coin crosses above the 9-day and 21-day moving averages. However, the long-term moving averages will begin the bullish movement as the market prepares for a new trend.
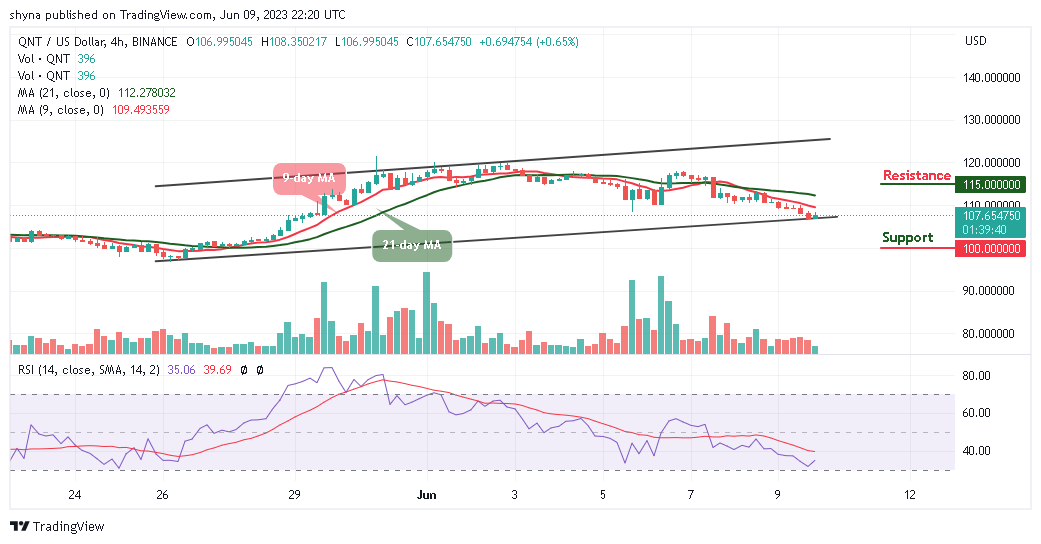
Therefore, if the buyers push the price above the moving averages, higher resistance could be located at $115 and above but the technical indicator Relative Strength Index (14) remains below the 40-level, suggesting a bullish movement. Moreover, should the bulls fail to move the current market value above, the bears may step into the market, and the nearest support level could be found at $100 and below.
Place winning Quant trades with us. Get QNT here