Chainlink Enters the Oversold Zone as It Seeks the $13.40 Level
Estimated Reading Time: 2 minutes
Don’t invest unless you’re prepared to lose all the money you invest. This is a high-risk investment and you are unlikely to be protected if something goes wrong. Take 2 minutes to learn more

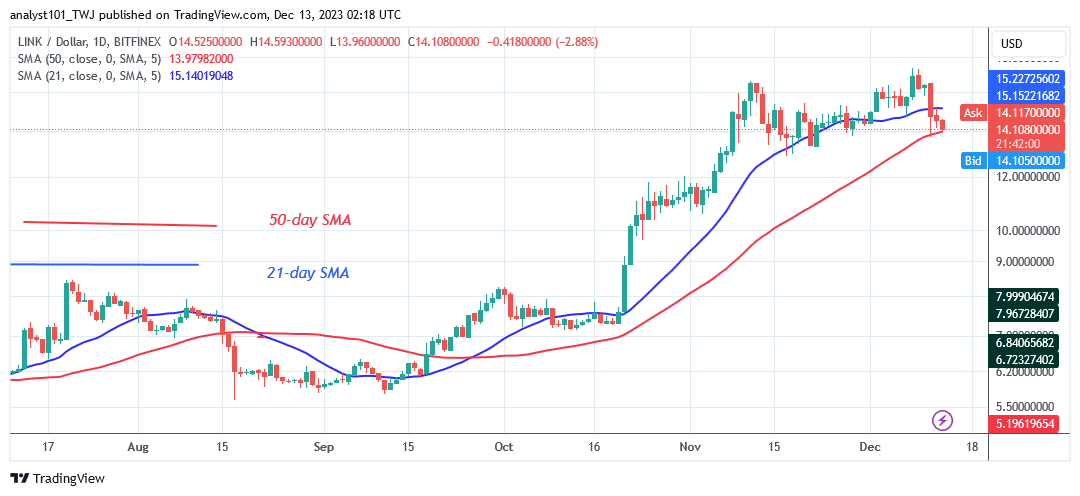
Chainlink (LINK) Long-Term Analysis: Bearish
Chainlink’s (LINK) upswing faces a second rejection at the high of $17.37 as it seeks the $13.40 level. The uptrend has been stopped since November 11 at the high of $16.50. Buyers failed to re-establish bullish momentum above the current high, resulting in the drop. The price of the cryptocurrency has dipped below the moving average lines, although it is still above the 50-day SMA.
In other words, at the time of writing, the LINK/USD price had dropped to a low of $13.94. There will be a significant decline in LINK if the bears breach the moving average lines. Should the 50-day SMA support hold, the altcoin’s volatility will return within a range.
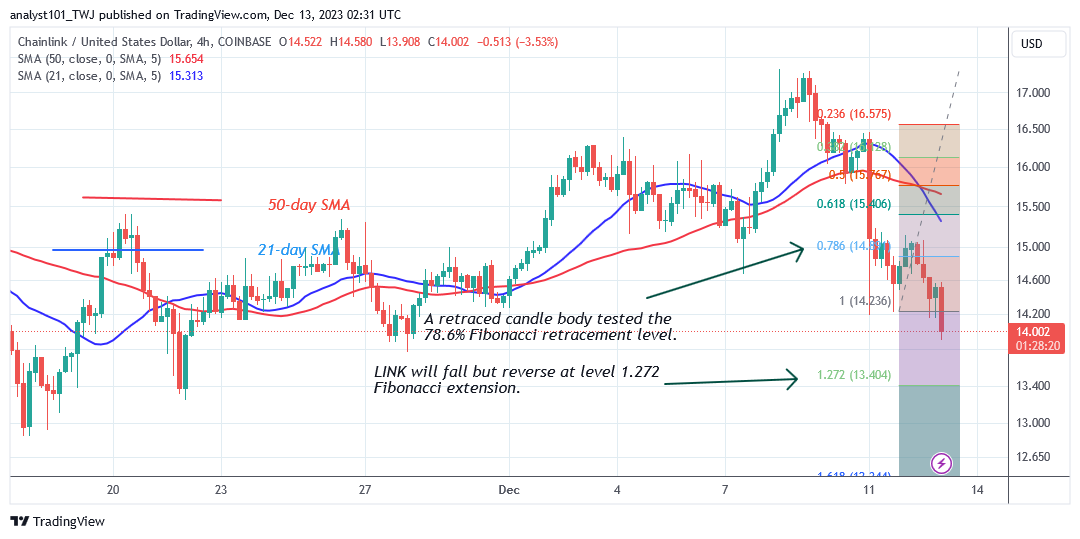
Chainlink (LINK) Indicator Analysis
Following the recent decline, Chainlink has slipped between the moving average lines. The price bars are in between the moving average lines as bears attempt to break below them. The bears have broken below the moving average lines on the 4-hour chart, indicating a fall.
What Is the Next Direction for Chainlink (LINK)?
The cryptocurrency asset has reached bearish exhaustion as it seeks the $13.40 level. The price indication has indicated a further decrease and a likely coin reversal. The indicator predicts that LINK will decrease but then reverse at the 1.272 Fibonacci extension or $13.40 level.
You can purchase crypto coins here. Buy LBLOCK
Note: Cryptosignals.org is not a financial advisor. Do your research before investing your funds in any financial asset or presented product or event. We are not responsible for your investing result