Chainlink Holds above $6.43 as It Revisits the Recent High
Estimated Reading Time: 2 minutes
Don’t invest unless you’re prepared to lose all the money you invest. This is a high-risk investment and you are unlikely to be protected if something goes wrong. Take 2 minutes to learn more
Chainlink (LINK) Long-Term Analysis: Bearish
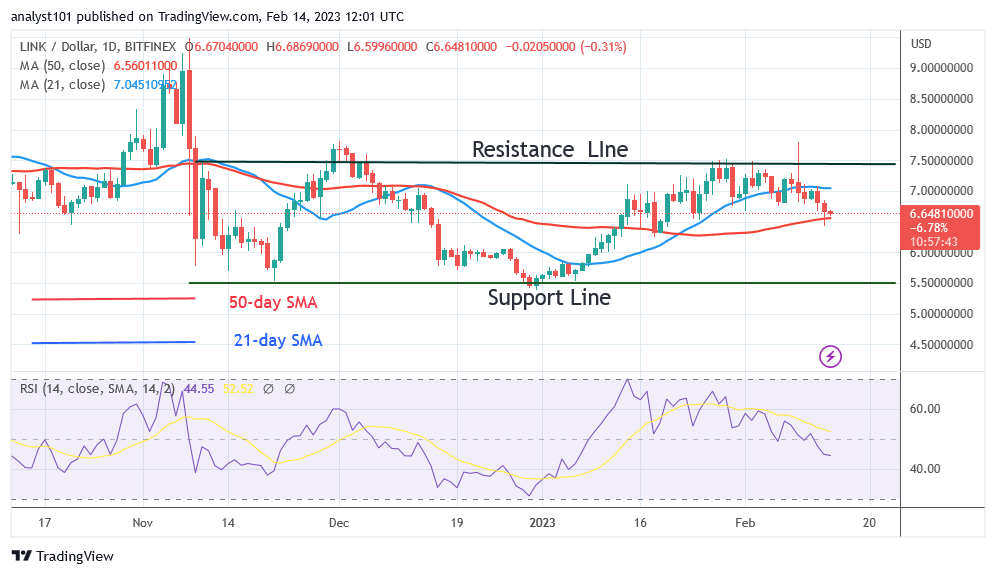
Chainlink (LINK) price has fallen below the moving average lines as it revisits the recent high. The crypto’s price has broken through the 21-day line SMA and continued to fall until it reached the support above the 50-day line SMA. If the price of LINK drops below the 50-day SMA, it will continue to fall. For instance, the altcoin’s price will drop to a low of $5.71 or $5.50. The 50-day SMA has momentarily halted the decline. If the current support holds, the chainlink will be forced to make a range-bound move. The altcoin is now trading at $6.58 as of this writing.
Chainlink (LINK) Indicator Analysis
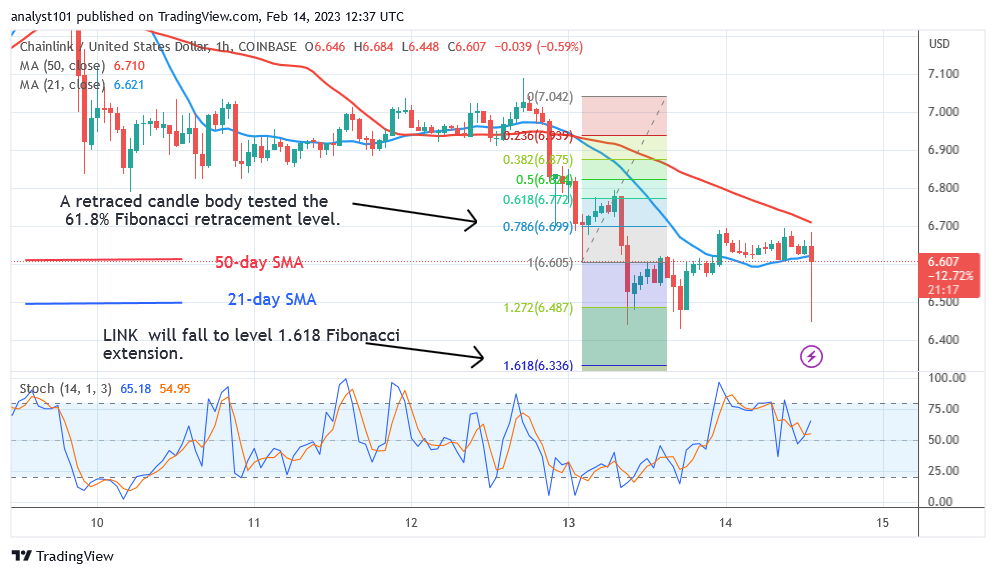
Chainlink has slipped into the area of the negative trend. The Relative Strength Index for period 14 is at level 43. The location of the price bars relative to the moving average lines indicates that the coin may move in a range. Below the daily Stochastic’s 50th point, the altcoin is moving in a bearish direction. The sideways sloping moving average lines represent the trend.
Technical indicators:
Major Resistance Levels – $18.00, $20.00, $22.00
Major Support Levels – $8.00, $6.00, $4.00
What Is the Next Direction for Chainlink (LINK)?
Chainlink is moving in a range as it revisits the recent high. Since November 2022, the cryptocurrency asset has been range-bound. The cost of the cryptocurrency has been ranging between $5.50 and $7.50.
You can purchase crypto coins here. Buy LBLOCK
Note: Cryptosignals.org is not a financial advisor. Do your research before investing your funds in any financial asset or presented product or event. We are not responsible for your investing results
____________________________________________________________________________